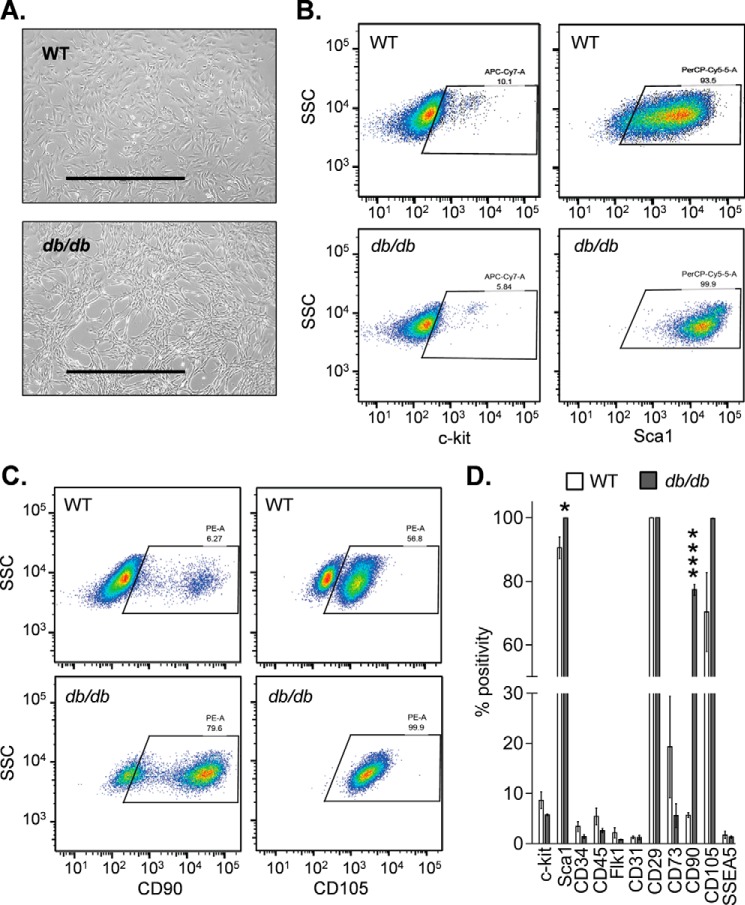
FIGURE 1.
Diabetic and nondiabetic CPCs display features characteristic of mesenchymal cells. Gross morphology and surface marker expression in CPCs isolated from nondiabetic (WT) and diabetic (db/db) mice are shown. A, brightfield images of WT and db/db CPCs. Scale bars, 1000 μm. B, representative flow cytometric dot plots of c-kit and Sca1. C, flow cytometric dot plots of CD90 and CD105. D, summary of surface marker expression. The data are representative of three independent experiments. *, p ≤ 0.05; ****, p < 0.0001 versus corresponding surface marker in the WT group.

