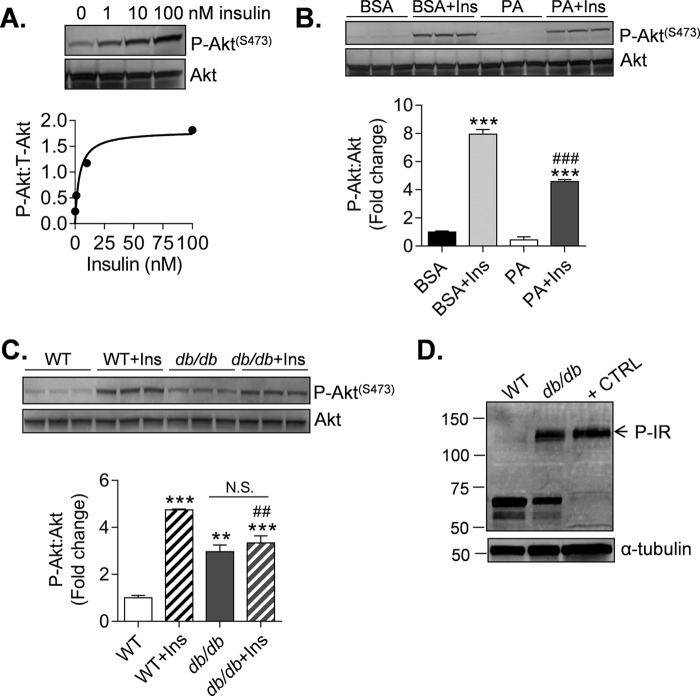
FIGURE 3.
Diabetes causes insulin resistance in CPCs. Immunoblots of markers of insulin resistance in CPCs are shown. A, phosphorylation of Akt (Ser473) from lysates derived from WT CPCs treated with 0–100 nm insulin for 15 min. The data are shown as discrete points. The curve is a best fit of the hyperbolic equation y = (max × x)/(K½ + x) to the data. Best fit values of max and K½ are 1.80 AU and 3.62 nm (r2 = 0.93). B, P-Akt measurements from lysates derived from WT CPCs treated with 100 μm palmitate (PA) conjugated to BSA or BSA alone (vehicle) for 3 h. The cells were then exposed to 10 nm insulin (Ins) for 15 min prior to harvest. The results represent three technical replicates/group. **, p ≤ 0.01; ***, p ≤ 0.001 versus corresponding group not treated with insulin. ###, p ≤ 0.01 versus BSA + Ins. C, P-Akt measurements from lysates derived from WT and db/db CPCs treated without or with 10 nm insulin for 15 min. The results represent three technical replicates/group. **, p ≤ 0.01; ***, p ≤ 0.001 versus WT; ##, p ≤ 0.01 versus WT + Ins. D, basal insulin receptor phosphorylation (P-IR) in WT and db/db CPCs. HUVECs stimulated with insulin were used as a positive control (+ CTRL).

