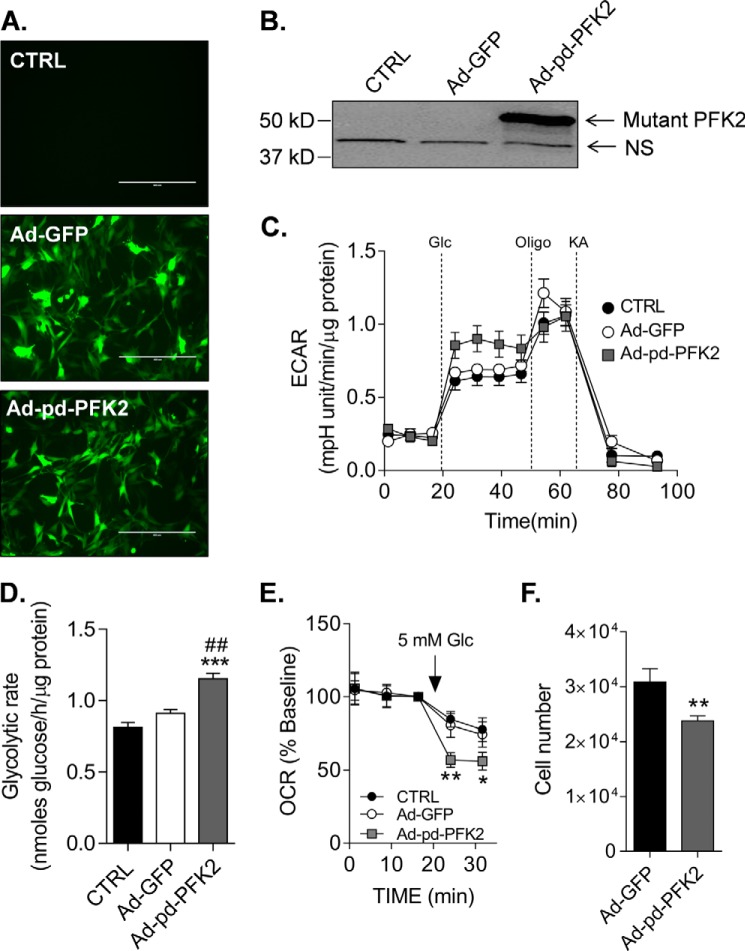
FIGURE 8.
Expression of a fructose-2,6-bisphosphatase-deficient PFK2 mutant phenocopies diabetes-induced losses of mitochondrial activity and proliferative capacity. Effects of mutant PFK2 adenoviral infection on CPCs are shown. A, representative fluorescence images of WT CPCs transduced with Ad-GFP or Ad-pd-PFK2 virus (100 MOI). Scale bars, 400 μm. B, representative Western blot of the pd-PFK2 enzyme in CPCs. The mutant PFK2 isoform was detected using an anti-PFKFB1 antibody. C, ECAR trace of WT CPCs left untransduced (black circles) or transduced with 100 MOI of Ad-GFP (open circles) or Ad-pd-PFK2 (gray squares) virus. The plot is representative of three independent experiments. D, radiometric measurement of glycolytic flux in WT CPCs left untransduced (CTRL) or transduced with Ad-GFP or Ad-pd-PFK2 viruses. The results represent three replicates/group. ***, p ≤ 0.001 versus untransduced (CTRL); ##, p ≤ 0.01 versus Ad-GFP. E, mitochondrial activity of WT CPCs left untransduced (CTRL) or transduced with Ad-GFP or Ad-pd-PFK2 viruses. The OCR is shown as a percentage of baseline to demonstrate the effects of glycolysis on mitochondrial activity upon exposure to glucose (Glc). The plot represents three independent experiments. F, proliferation of WT CPCs transduced with Ad-GFP or Ad-pd-PFK2 viruses. The cells were transduced with virus, and after 48 h, equal numbers of the cells were seeded. After an additional 48 h, the number of cells in each well was counted. The plot represents three independent experiments. *, p ≤ 0.05; **, p ≤ 0.01 versus untransduced (CTRL) and/or Ad-GFP.

