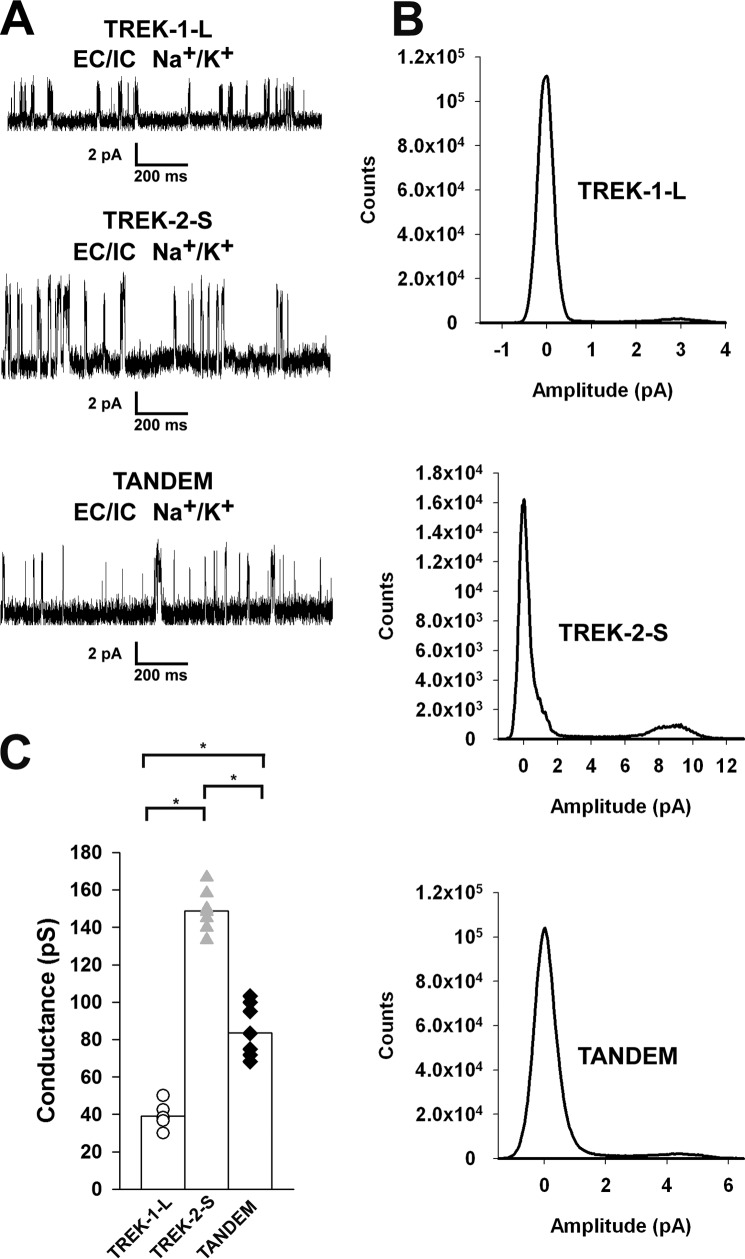
FIGURE 3.
Different single channel conductances of N-terminal mutant TREK channels. TREK-1-L, TREK-2-S, and TREK-2-S/TREK-1-L tandem channels were expressed in Xenopus oocytes. Currents were recorded from inside-out membrane patches at a membrane potential of +60 mV. The pipette solution contained (in mm) the following: 136 NaCl, 4 KCl, 5 EGTA, and 10 HEPES (pH 7.4 adjusted with NaOH). Bath solution contained (in mm) the following: 140 KCl, 5 EGTA, and 10 HEPES (pH 7.1 adjusted with KOH). The charge carrier of the currents recorded was verified by K+-free bath solution (140 NaCl, 5 EGTA, and 10 HEPES, pH 7.1 adjusted with NaOH). The current traces displayed were filtered at 2 kHz. A, representative current recordings of inside-out membrane patches from Xenopus oocytes expressing TREK-1-L (top), TREK-2-S (middle), and TREK-2-S/TREK-1-L tandem (bottom) in a high [K+] bath solution at a membrane potential of +60 mV. No outward current was detected in K+-free bath solution. Currents were recorded in high [K+] bath solution for 30–60 s. B, all points histograms were created from recordings of TREK-1-L (top), TREK-2-S (middle), and TREK-2-S/TREK-1-L tandem (bottom). Unitary currents and single channel conductances were calculated from the amplitude histograms. C, single channel conductances of TREK-1-L (white circles, n = 6 patches), TREK-2-S (gray triangles, n = 7 patches), and TREK-2-S/TREK-1-L (black diamonds, n = 8 patches) are displayed as a scatterplot. The averages of the three groups are plotted as columns. The difference between the conductance of all three groups was found to be statistically significant (p < 0.01). * represents significant differences.

