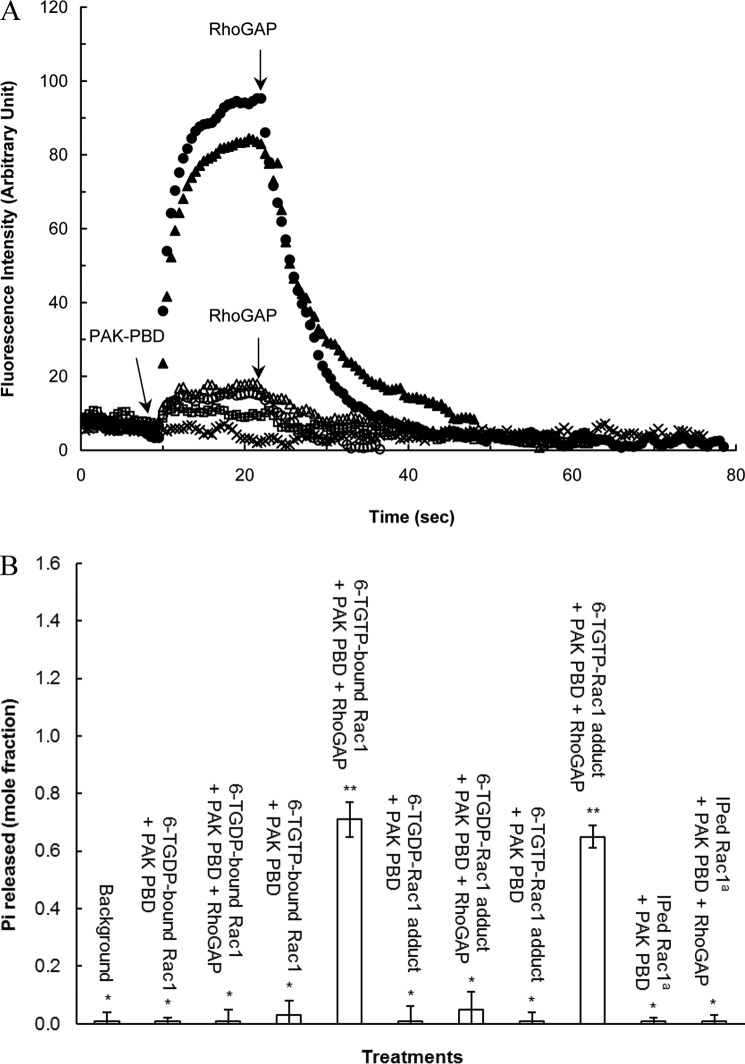
FIGURE 4.
Although the 6-TGDP-Rac1 adduct is biologically inactive, the 6-TGTP-Rac1 adduct is biologically active. A, fluorescence rhodamine B-based binding assays of the rhodamine B-attached 6-TGNP-Rac1 adduct, the rhodamine B-attached 6-TGNP-bound Rac1, and IPed Rac1 with PAK-PBD in the presence and absence of RhoGAP were performed as described under “Experimental Procedures.” The addition of PAK-PBD followed by the addition of RhoGAP to the assay cuvette containing the rhodamine B-attached 6-TGTP-Rac1 adduct (▴), the rhodamine B-attached 6-TGDP-Rac1 adduct (▵), the rhodamine B-attached 6-TGTP-bound Rac1 (●), the rhodamine B-attached 6-TGDP-bound Rac1 (○), and the rhodamine B-attached IPed Rac1 from CD4+ cells treated with 6-TG and DETA/NO (□) was as indicated by the arrows. Note that the fluorescence spectrum of the rhodamine B-attached IPed Rac1 from CD4+ cells treated only with 6-TG was omitted because it overlapped with that of the rhodamine B-attached IPed Rac1 from CD4+ cells treated with 6-TG and DETA/NO. The rhodamine B-attached GTP-bound Rac1 that was not treated with PAK-PBD and/or RhoGAP (×) was used as a control. The rhodamine B-attached GDP-bound Rac1 that also was not treated with PAK-PBD and/or RhoGAP was used as a control. Nevertheless, its spectrum is almost identical to that of the rhodamine B-attached GTP-bound Rac1, and thus it is omitted for clarity. B, quantification of the Pi released from the 6-TGNP-bound Rac1, 6-TGNP-Rac1 adduct, and IPed Rac1 from CD4+ cells treated with 6-TG and DETA/NO with and without RhoGAP was determined by using malachite green as described under “Experimental Procedures.” The Pi quantities measured were then converted into the mole fractions (mole of Pi released/mol of 6-TGNP-bound Rac1 or 6-TGNP-Rac1 adduct). Note that the Pi value associated with its standard deviations determined for the IPed Rac1 from CD4+ cells treated only with 6-TG is identical to that for the IPed Rac1 from CD4+ cells treated with 6-TG and DETA/NO, and thus is not shown. The mean values data are represented with S.D. bars associated with three independent experiments. Statistical results from the ANOVA Tukey test were as follows: *, p < 0.01, versus the 6-TGTP-bound Rac1 treatment without RhoGAP; **, p < 0.01, versus the 6-TGTP-bound Rac1 treatment with RhoGAP. a, IPed Rac1, Rac1 IPed from CD4+ cells treated with 6-TG only.

