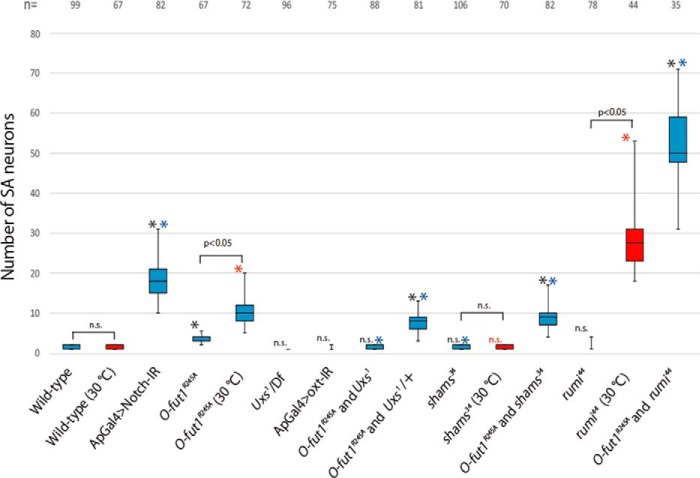
FIGURE 4.
The number of SA neurons in various single and double mutants. Box plots of the number of SA neurons (vertical axis) for each genotype (across the bottom). Representative results are shown in Figs. 2 and 3. SA neurons were identified by anti-Sens antibody staining in wing discs isolated from third-instar larvae raised at 25 °C (blue boxes) or 30 °C (red boxes); black asterisks and n.s. indicate: *, p < 0.05 and no significant difference, respectively, compared with wild-type at 25 °C. Blue asterisks indicate: *, p < 0.05 compared with O-fut1R245A homozygotes at 25 °C. Red asterisks and n.s. indicate: *, p < 0.05 and no significant difference, respectively, compared with wild-type at 30 °C. The number of wing discs analyzed in each experiment (biological replicates) is shown at the top of the graph. Each experiment was done three times.

