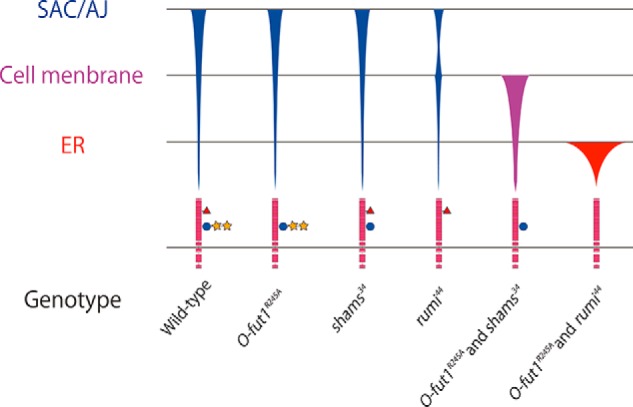
FIGURE 7.

Graphical representation of Notch distribution in each mutant. Schematic showing the final destinations of Notch transport at 25 °C in various genotypes (indicated at the bottom). SAC/AJ, subapical complex/adherens junction. Symbols: pink boxes, EGF-like repeats; red triangles, O-fucosylation; blue circles, O-glucosylation; and yellow stars, xylose. The thickness of the bars qualitatively represents the amount of Notch protein at each location.
