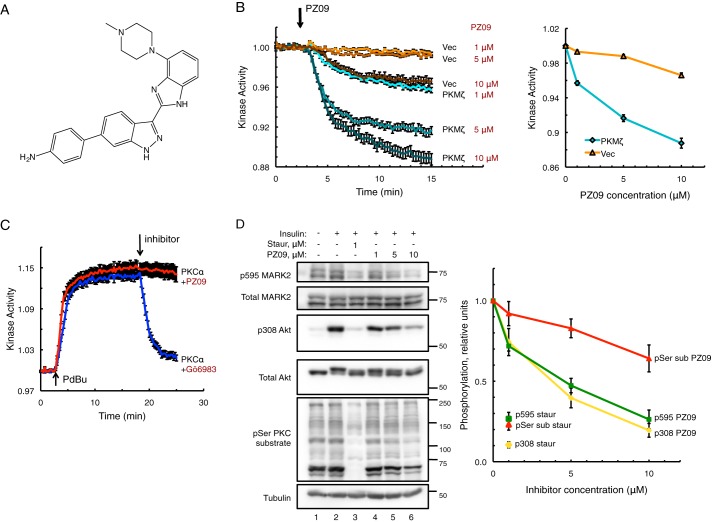
FIGURE 1.
PZ09 inhibits atypical PKCs but not conventional PKCs in cells. A, chemical structure of PZ09. B, basal kinase activity measured via changes in CFP over FRET ratio using PKC-specific substrate reporter CKAR and mCherry-tagged PKMζ versus mCherry-Vec control in live COS-7 cells treated with increasing concentrations of aPKC inhibitor PZ09. The trace for each cell imaged was normalized to its t = 0-min baseline value and plotted as means ± S.E. Normalized FRET ratios were combined from three independent experiments (all PKMζ traces and Vec 1 μm and 10 μm traces) or five independent experiments for Vec 5 μm, with each experiment analyzing 6–12 selected cells. Inhibitory response curve is plotted as amplitude of drop from baseline activity at 15-min time point versus PZ09 concentration. C, stimulated kinase activity on CKAR of mCherry-PKCα after treatment with 200 nm phorbol dibutyrate (PDBu) followed by treatment with either cPKC/novel PKC-specific inhibitor Gö6983 (250 nm) or PZ09 (5 μm). The trace for each cell imaged was normalized to its t = 0-min baseline value, and normalized FRET ratios were combined from three independent experiments with analysis of 8–12 selected cells each and plotted as mean ± S.E. D, COS-7 cells were serum-starved overnight and treated with either DMSO, staurosporine (Staur) (1 μm), or increasing concentrations of PZ09 for 30 min prior to stimulation with 100 nm insulin for 10 min before lysis. Immunoblots show endogenous substrate phosphorylation representing aPKC inhibition (p595 MARK2), PDK1 inhibition (insulin-stimulated p308 Akt), and cPKC inhibition (pSer sub, using an antibody for a PKC-specific serine substrate sequence). Quantification of phosphorylated protein substrate over total protein normalized to DMSO + insulin control using n = 5 separate experiments plotted as mean ± S.E. versus inhibitor concentration (PZ09 or staurosporine) is shown. Phosphorylated PKC serine substrate was quantified as the intensity of the total band ensemble detected between 50 and 250 kDa divided by tubulin signal and normalized to DMSO + insulin control.

