
Figure 7.
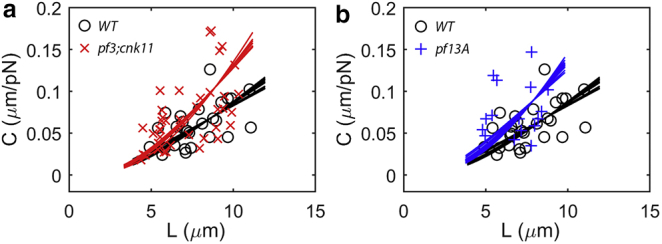
Flexural rigidity and shear stiffness are estimated from tip compliance and flagellar length by fitting the theoretical compliance-length relationship (Eq. 8) to data from the optical tweezers experiment. Each data point represents the tip compliance of an individual flagellum of either the (a) wild-type (WT) or pf3; cnk11-6 mutant, or (b) WT or pf13A mutants. Each curve shows the theoretical compliance-length relationship (Eq. 8) for an estimate of β2 from a specific counterbend experiment in the corresponding flagella type, using the value of ks (or equivalently, EI) that minimizes the total squared residual error. The mean (± SD) fraction of the variance explained by these curve fits is R2 = 0.89 ± 0.01 in wild-type (N = 12 curve fits), R2 = 0.76 ± 0.01 in pf3; cnk11-6 (N = 8), and R2 = 0.79 ± 0.01 in pf13A (N = 11). To see this figure in color, go online.