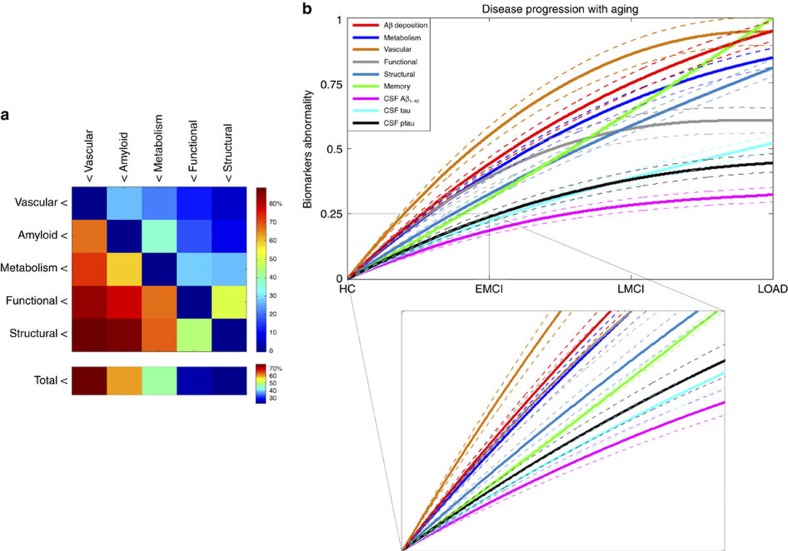
Figure 3. Data-driven spatiotemporal ordering in LOAD progression.
(a) Hierarchical matrix reflecting pairwise comparisons in factor abnormality levels. Element i,j represents the total percentage of regions and time points at which the biological factor j is more abnormal than is the factor i. (b) Multifactorial temporal ordering in disease progression, based on the factor-specific abnormality trajectories (temporal abnormalities averaged across all brain regions), memory deficit and three CSF biomarkers (Aβ1−42, tau and ptau). All of the results were calculated for the HC to LOAD clinical transition. Dotted lines indicate 95 % confidence intervals, reflecting the uncertainties associated to the estimated mean trajectories, and obtained with 500 bootstrapping resamples. Inset figure provides detail of the trajectories obtained for early states of the disease (HC to EMCI transition). Note how in the initial states the vascular component is separating from the other components, while Aβ, metabolism and functional dysregulation remain close, with a notable overlap among their confidence intervals, until more advanced pathological states. See Supplementary Fig. 2 for equivalent results obtained evaluating the model assuming a sigmoid (instead of linear) relationship between age and disease state, respectively.

