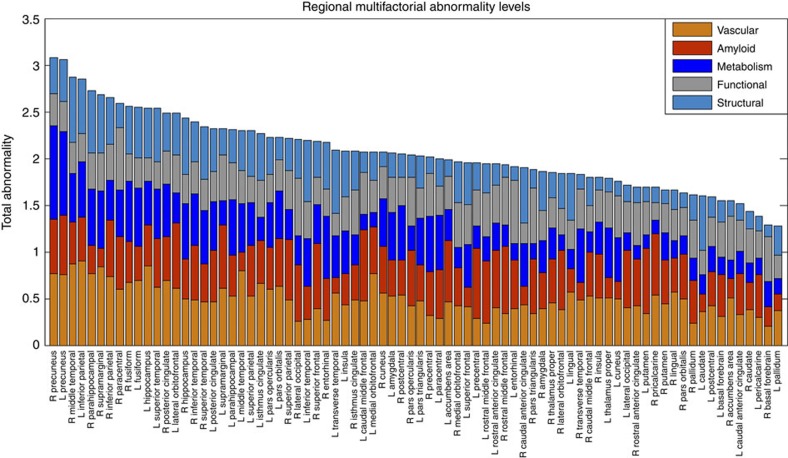
Figure 4. Regional total abnormality levels associated with LOAD progression.
Brain regions were sorted from maximum to minimum total effect values, to illustrate their multifactorial damage. Note the across-brain consistent change in the vascular component, which is considerably less prominent for other factors (for example, functional and structural alterations).

