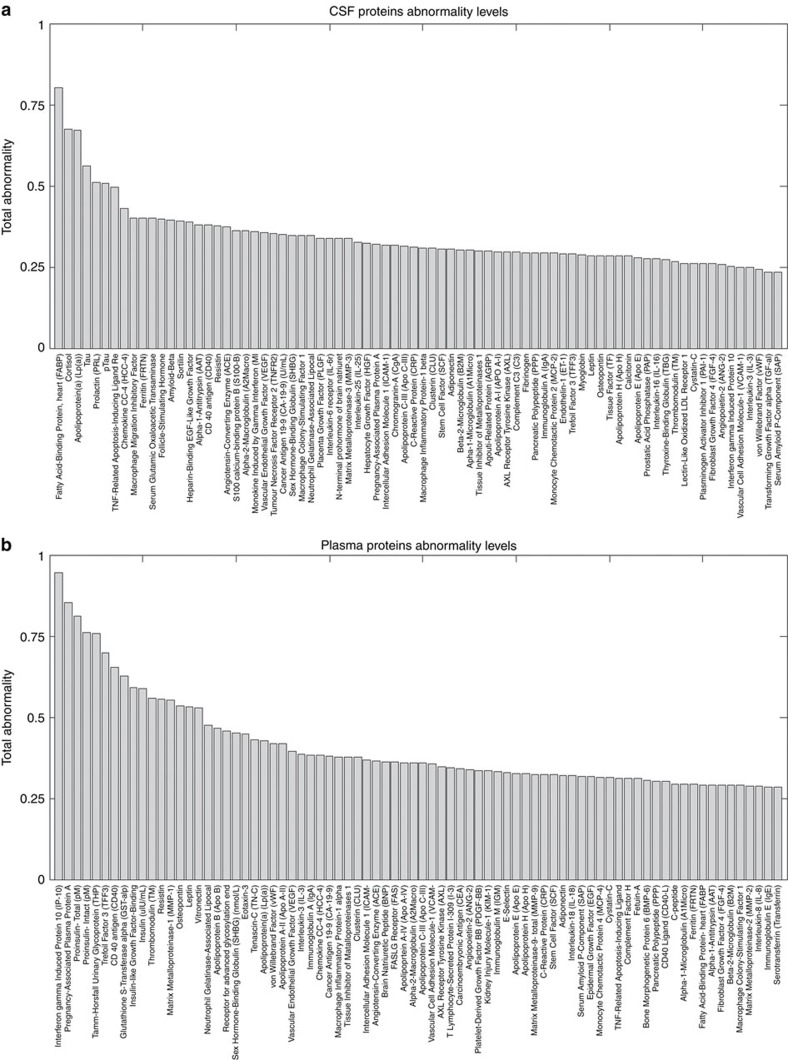
Figure 5. Total CSF and plasma biomarkers abnormality levels associated with LOAD progression.
Total CSF (a) and plasma (b) biomarkers abnormality levels associated with LOAD progression. For detailed lists of biospecimens and the obtained abnormality values for intermediate disease states, see Supplementary Tables 2 and 3.

