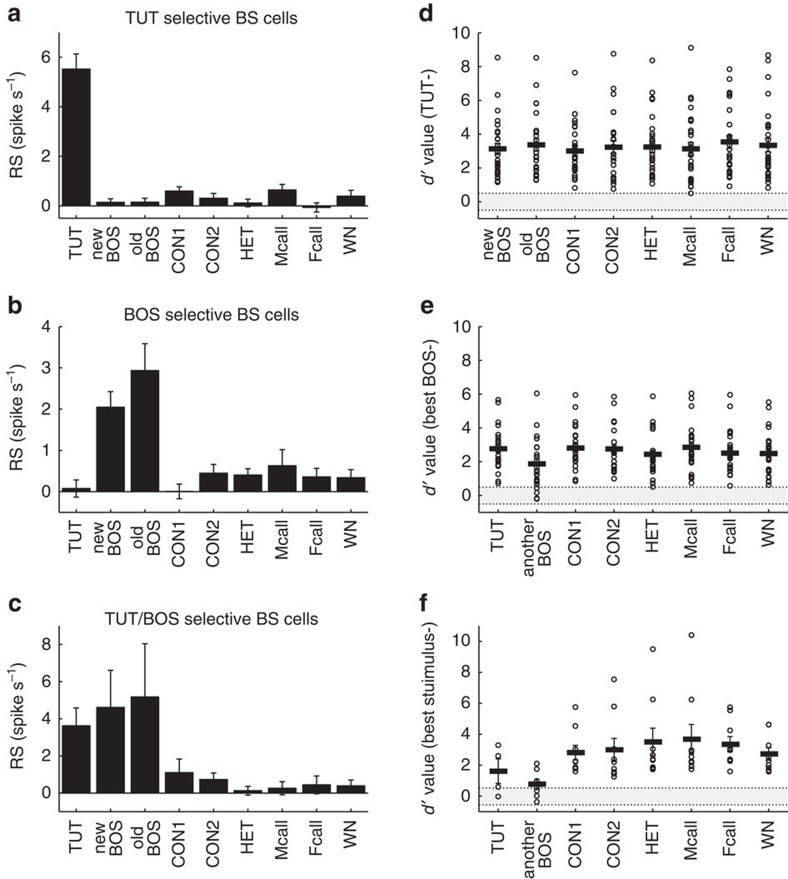
Figure 4. Sharply tuned auditory responses in song-selective BS neurons.
(a–c) Mean RS (response strength) of TUT- (a), BOS- (b) and TUT/BOS-selective (c) BS neurons to each sound stimulus. The RS for tuned stimuli is significantly higher than those for all other stimuli. Mean±s.e.m., n=27, 26 and 9 for TUT-, BOS- and TUT/BOS-selective neurons, respectively, P<0.001 by Kruskal–Wallis test. (d–f) d values for best stimulus over other sound stimuli of TUT- (d) BOS- (e) and TUT/BOS- (f) selective neurons. The best stimulus for TUT neurons was the TUT. The best stimulus for BOS neurons was the old or new BOS, and the best stimulus for TUT/BOS neurons was either the TUT, old BOS or new BOS. Each open circle represents data from a single neuron. Black bars indicate mean d values. Grey areas indicate non-selective neurons (−0.5<d value<0.5). Note that all of the d value comparisons with unbiased stimuli are higher than 0.5.

