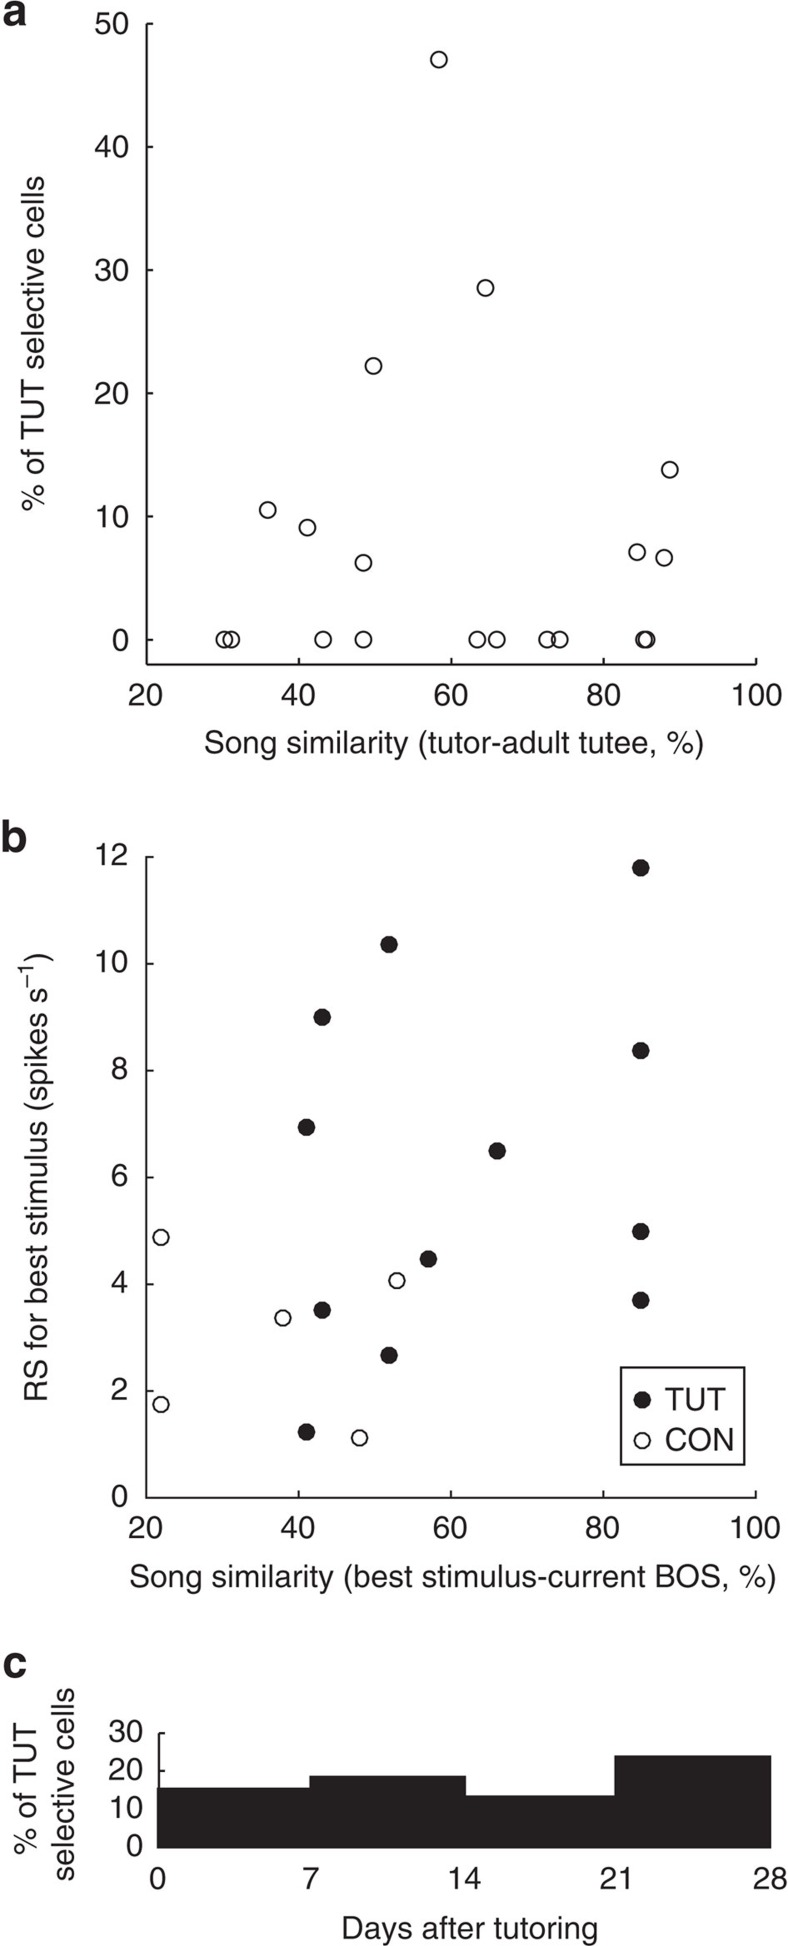
Figure 5. TUT-selective responses do not correlate with vocal learning from TUT.
(a) The proportion of TUT-selective neurons recorded in a bird, is a function of song similarity between a bird's own song and the tutor song. There is no significant correlation between them (r=−0.02, P>0.1, n=19 birds). (b) Response strength (RS) to the TUT or CON in TUT-selective neurons (closed circle) or CON-selective neurons (open circle), respectively, in the function of song similarity between BOS, recorded ≤3 days before electrophysiology recording, and TUT or CON. There was no significant correlation between RS to TUT and similarity to TUT (r=0.27, P>0.1, 12 TUT-selective neurons from six birds), RS to CON and similarity to CON (r=0.15, P>0.1, 5 CON-selective neurons, four birds), and all RS to TUT/CON and similarity to TUT/CON. (r=0.42, P>0.05, 17 selective neurons, eight birds). (c) The proportion of TUT-selective neurons recorded among all BS-neurons recorded during each time period after tutoring (21 TUT-selective neurons, eight birds).

