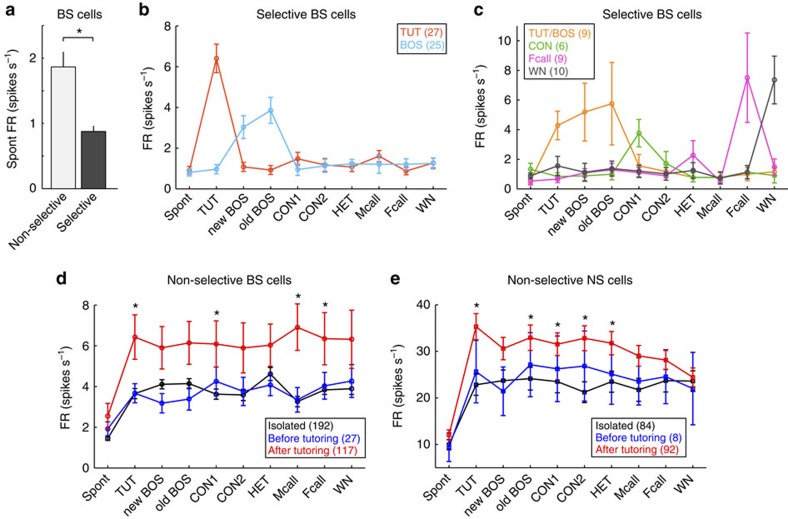
Figure 6. TUT experience alters neuronal activity of song-selective BS neurons.
(a) Spontaneous firing rates (FR, spikes s−1) of non-selective and selective BS neurons. (Mean±s.e.m., n=337 and 132 for non-selective and selective BS neurons, respectively, *P<0.001, Mann–Whitney U-test). (b,c) Mean spontaneous firing rates (Spont) and firing rates during presentation of each song stimulation, in song-selective BS neurons (TUT and BOS-selective BS-neurons (b) and TUT/BOS, CON, Fcall and WN selective neurons (c), mean±s.e.m.). Numbers in parentheses indicate numbers of neurons. (d,e) Mean spontaneous firing rates (Spont) and firing rates during presentation of each song stimulation, in nonselective BS neurons (d) and NS neurons (e), recorded before tutoring (blue), after tutoring (red), and in isolated (black) birds. Asterisks indicate significant differences between isolated and after-tutoring birds (P<0.05, Tukey–Kramer's multiple comparison test).

