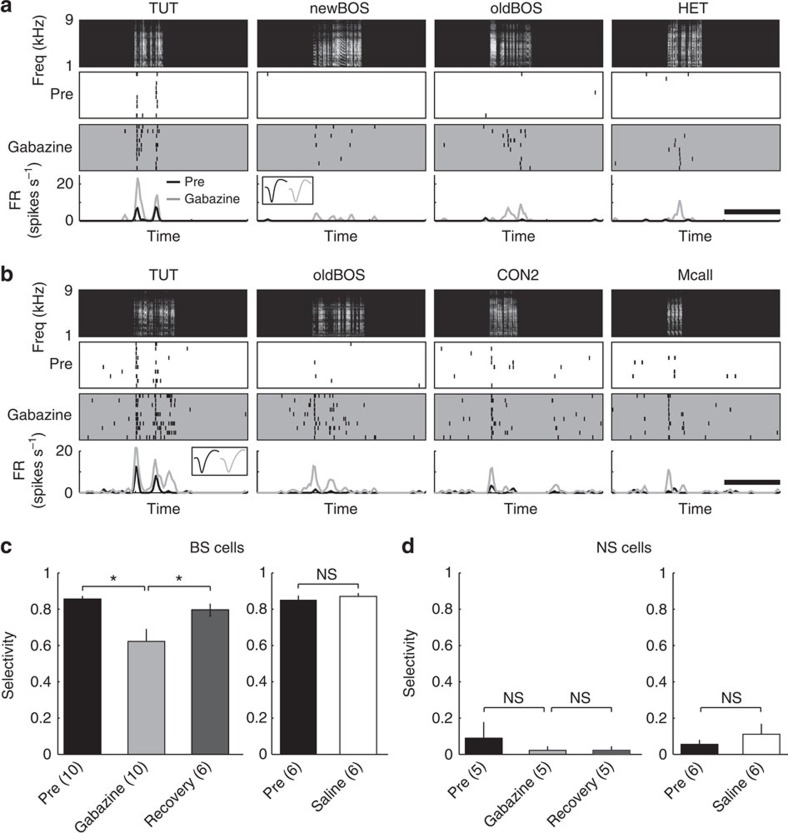
Figure 7. Blocking GABAergic inhibition decreases selectivity in BS neurons.
(a,b) Representative auditory responses of TUT-selective BS neurons before and after gabazine injection. Neural responses to each sound stimulus before and after gabazine application are shown with raster plots (middle) and mean firing rate (FR) curves (bottom) and are time-aligned with spectrograms of sound stimuli (top). Inset: mean spike waveforms before (pre: black) and after gabazine (grey) injection. Scale bars, 2 s (c,d) Mean selectivity index before and after gabazine (left) or saline control (right) injection in BS (c) and NS (d) neurons. Data for Pre, gabazine/saline and recovery are summarized 10 min before and 20 and 60 min after gabazine/saline injection. BS neurons exhibited significantly lower selectivity after gabazine injection (left panel), whereas saline injection did not affect selectivity (right panel). By contrast, gabazine had no effect on NS neurons, which show less selectivity. Numbers in parentheses denote the number of neurons in each group. Mean±s.e.m. *P<0.005 by Wilcoxon signed-rank test.

