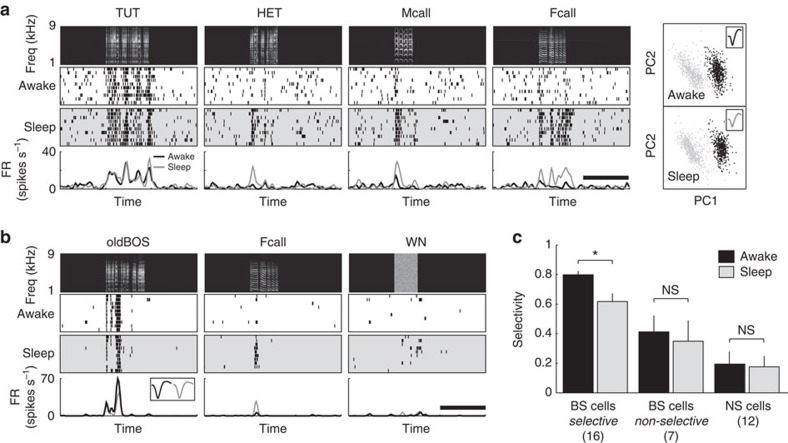
Figure 8. State-dependent modulation of song selectivity in the NCM.
(a,b) Representative auditory responses of TUT- (a) and BOS-selective (b) BS neurons during wakefulness and sleep. Neuronal responses during wakefulness and sleep are shown with raster plots (middle) and mean firing rate curves (bottom) time-aligned spectrograms of the sound stimuli (top). Spike clusters (right panels in a) and spike waveforms (inset) during wakefulness and sleep states did not differ. Scale bars, 2 s (c). The selectivity index during wakefulness and sleep states in song-selective and non-selective BS neurons, and NS neurons. Song-selective BS neurons exhibited significantly lower selectivity during sleep than wakefulness, whereas selectivity did not change between wakefulness and sleep in non-selective BS neurons and NS neurons. Numbers in parentheses denote the number of neurons in each group. Mean±s.e.m., *P<0.01 by Wilcoxon signed-rank test.

