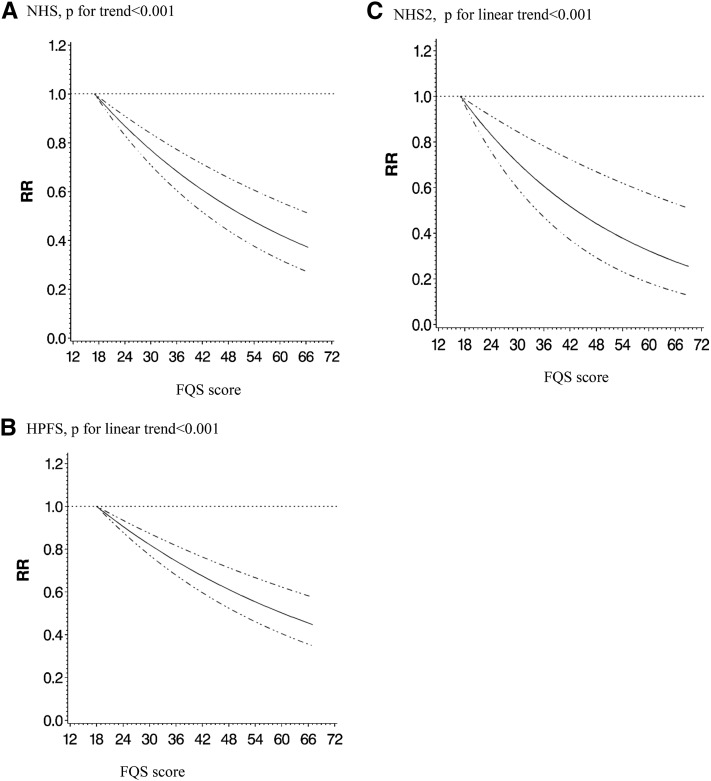
FIGURE 1.
Multivariable spline regression of FQS and coronary artery disease. Values were adjusted for age, BMI, smoking, physical activity, family history of diabetes, energy intake, alcohol intake, postmenopausal hormone use (NHS and NHS II), and oral contraceptive use (NHS II). n = 71,415 from the NHS (A), 42,495 from the HPFS (B), and 93,131 from the NHS II (C). The solid lines indicate RRs, and the dotted lines indicate 95% CIs. FQS, Food Quality Score; HPFS, Health Professionals Follow-Up Study; NHS, Nurses’ Health Study; NHS II, Nurses’ Health Study II.

