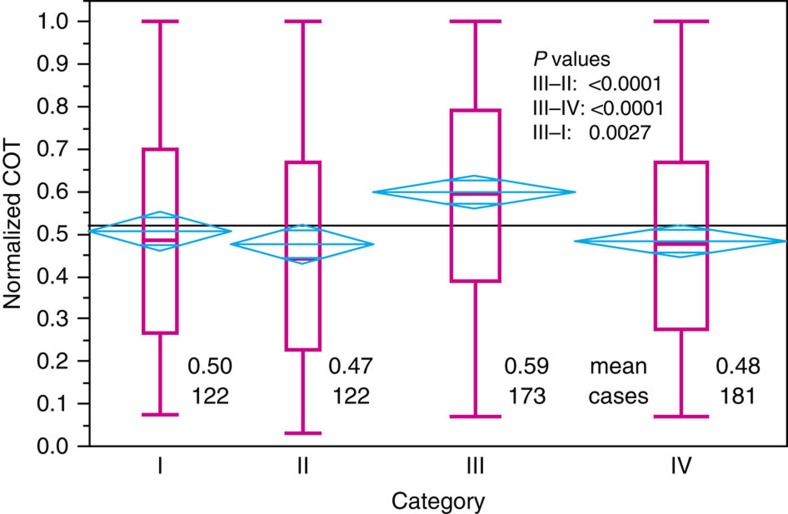
Figure 5. Cirrus cloud optical thickness per category for a maximum cirrus geometrical depth of 2.5 km.
The magenta box-and-whisker plots show the quantiles for the data in each category from a one-way analysis of variance using the JMP software package. Mean diamonds (cyan) indicate the 95% confidence intervals for the mean values of each of the categories. If the upper and lower horizontal lines overlap, there is no statistically significant difference in means. Numbers in the lower part of the figure give the mean value and number of observations (that is, CALIPSO L2 5-km points) in each category. The horizontal grey line represents the overall mean value.

