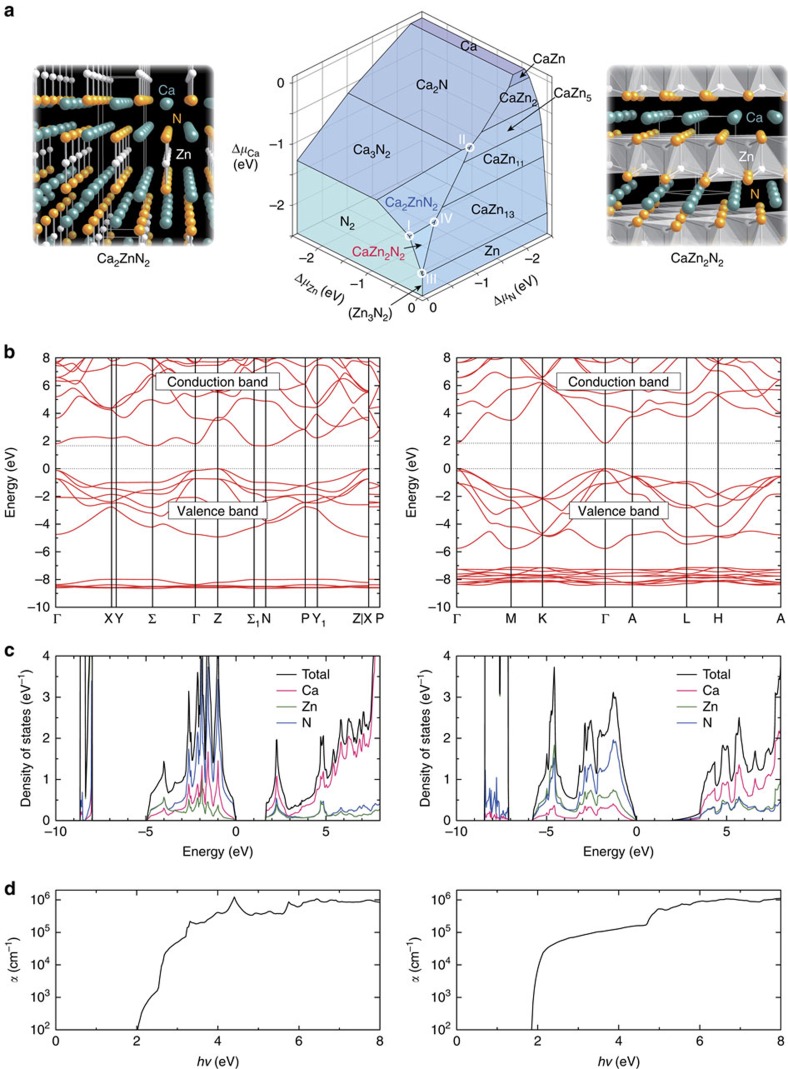
Figure 2. Theoretically predicted characteristics of Ca2ZnN2 and CaZn2N2.
(a) Ca–Zn–N ternary phase diagram at 0 K and 0 GPa, showing the stable region of Ca2ZnN2 and CaZn2N2 in the chemical potential space. The chemical potentials Δμi (i=Ca, Zn and N) are relative to those at the standard states, which are taken to be the Ca and Zn metals, and the N2 molecule. The Zn3N2 phase is metastable and indicated in parenthesis. Chemical potential conditions I–IV are considered in the discussion of point-defect energetics. On the left and right sides of panel are the crystal structures of Ca2ZnN2 and CaZn2N2, respectively. The frames represent the conventional unit cells (I4/mmm (tetragonal) and  (trigonal), respectively). The Ca atoms (green) and Zn atoms (white) are coordinated by five and two N atoms (yellow), respectively, in Ca2ZnN2, whereas by six and four N atoms in CaZn2N2; only Zn–N bonds are illustrated for easy visualization. (b) Electronic band structures. (c) Total and site-projected electronic densities of states per formula unit. (d) Absorption spectra (α: absorption coefficient; hν: photon energy). For b–d, the left and right sides of each panel show results for Ca2ZnN2 and CaZn2N2, respectively.

