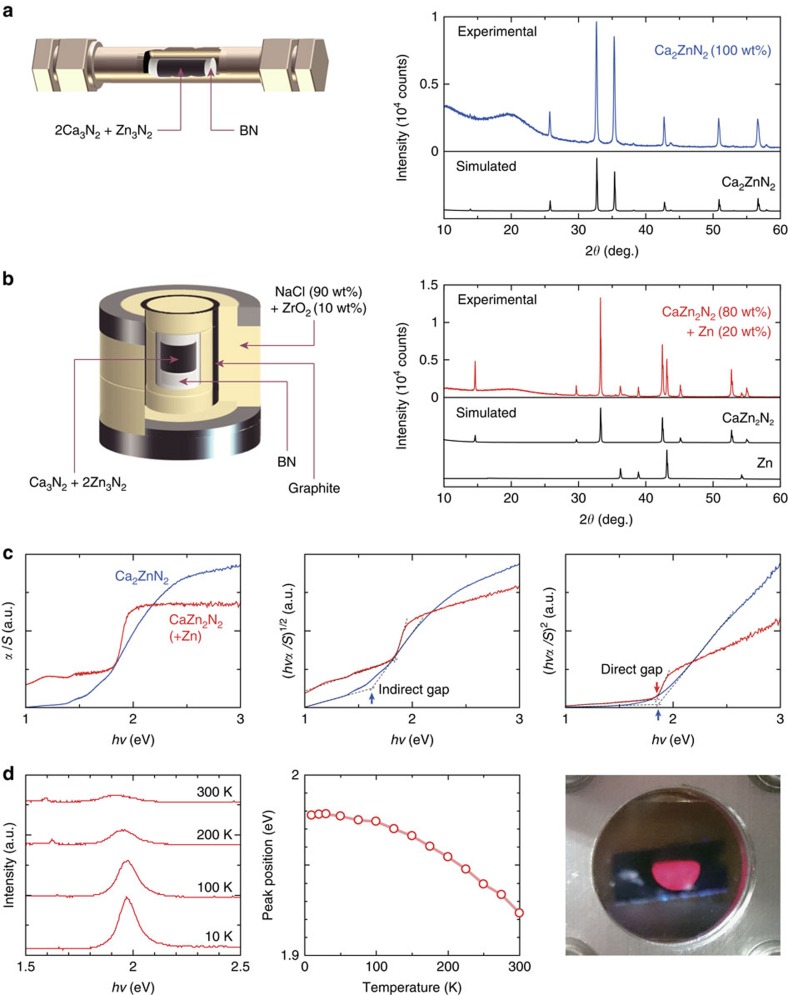
Figure 3. Experimental verification of the Ca2ZnN2 and CaZn2N2 phases.
Schematics of experimental set-ups and X-ray diffraction profiles for (a) a polycrystalline sample with a starting composition of Ca:Zn:N=2:1:2 aiming at the formation of the Ca2ZnN2 phase, which was encapsulated in a sealed steel tube and annealed at 680 °C for 40 h, and (b) a polycrystalline sample treated at 1200 °C and 5.0 GPa for 1 h with a starting composition of 1:2:2 corresponding to CaZn2N2. Also shown are simulated profiles that were obtained on the basis of the theoretically predicted crystal structure of CaZn2N2 and the reported crystal structures of Ca2ZnN2 and Zn. The broad peaks around 2θ=20° originate from sample capsules used in the measurements. (c) Absorption spectra of Ca2ZnN2 and CaZn2N2 derived from diffuse reflectance spectra at 300 K and the Kubelka–Munk relation (α: absorption coefficient; S: scattering factor; and hν: photon energy). (d) Photoluminescence (PL) from CaZn2N2: PL spectra at 10, 100, 200 and 300 K (left of panel), the temperature dependence of the PL peak position (middle of panel) and a photograph of red PL at 10 K (right of panel).

