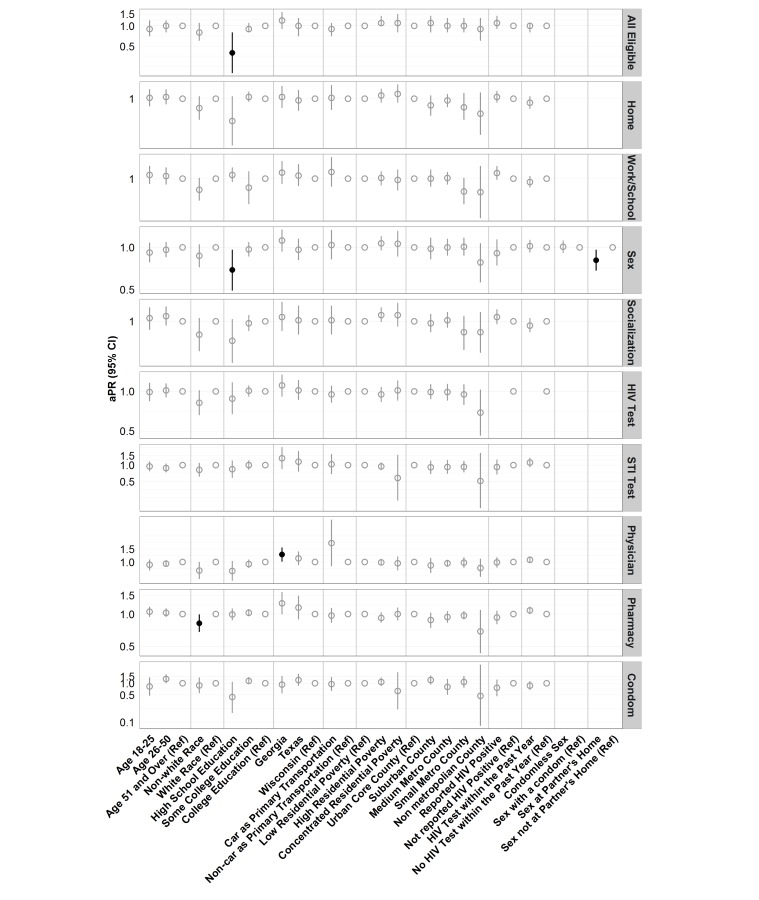
Figure 3.
Adjusted prevalence ratios (aPR) and 95% CI for answering all eligible map questions and specific map questions by each covariate. aPRs are adjusted by all other covariates. Statistically significant aPRs are indicated with black filled circles. The scale of the y axis is logarithmic and differs across location types to better visualize the CI.

