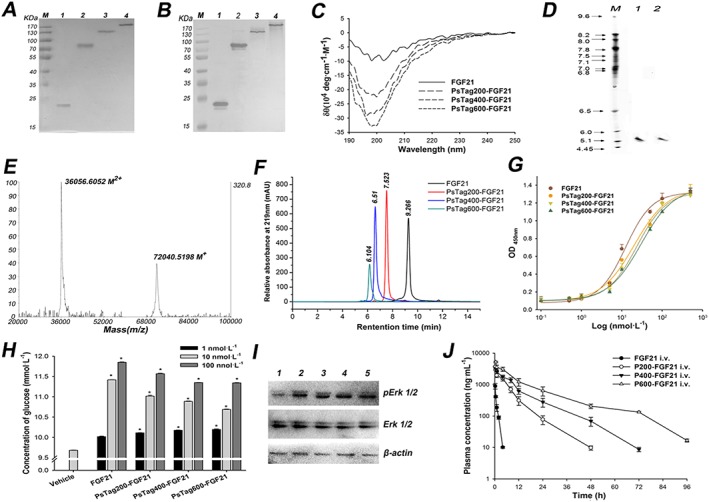
Figure 3.

The characterization of FGF21 and fusion proteins. The unmodified FGF21 and fusion proteins were assayed by (A) 12% SDS‐PAGE and (B) Western blotting with a rabbit anti‐human FGF21 antibody (lane 1: FGF21; lane 2: PsTag200‐FGF21; lane 3: PsTag400‐FGF21; lane 4: PsTag600‐FGF21). (C) CD spectra of unmodified FGF21 and fusion proteins. (D) IEF of FGF21 and PsTag600‐FGF21 (lane 1: PsTag600‐FGF21; lane 2: FGF21). (E) MALDI‐TOF mass spectrometry of PsTag600‐FGF21 (M+ and M2 + refer to the singly and doubly charged ionic species of PsTag600‐FGF21 respectively. (F) SEC‐HPLC in the presence of 150 mmol·L−1 sodium phosphate buffer (pH 7.0) resulted in a single peak with decreasing elution time for PsTag fusion proteins with increasing number of amino acid residues. (G) Binding affinities of FGF21 and PsTag fusion proteins to human β‐klotho were examined by direct binding elisa. (H) Cellular glucose uptake stimulated by native FGF21 and PsTag fused FGF21 in 3 T3‐L1 cells. n = 3. *P < 0.05 versus vehicle control. (I) 3T3‐L1 cells were treated with vehicle (lane 1), 10 nmol·L−1 FGF21 (lane 2), 10 nmol·L−1 PsTag200‐FGF21 (lane 3), 10 nmol·L−1 PsTag400‐FGF21 (lane 4) and 10 nmol·L−1 PsTag600‐FGF21 (lane 5) for 10 min. Phospho‐specific antibody was used to determine phosphorylation of ERK. (J) Pharmacokinetic plasma profile of native FGF21 and PsTag fusion proteins intravenously injected in C57BL/6 mice (n = 10 per group).
