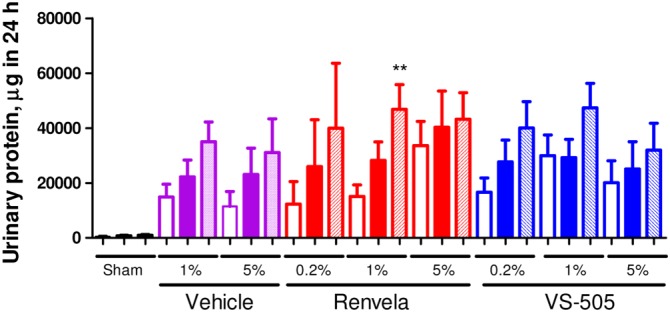
Figure 5.

Urinary protein in 5/6 NX rats. NX rats were treated as described in Figure 3. Urine samples were collected for protein determination as described in the ‘Methods’ section. Mean ± SEM was calculated for each group. The final number of rats per group was as presented in Table 1. Differences among pre‐dosing, week 2 and week 4 groups were assessed using a one‐way ANOVA followed by a Dunnett's post hoc test. **P < 0.01 versus pre‐dosing. Open bar: pre‐dosing. Solid bar: week 2 post‐dosing. Pattern bar: week 4 post‐dosing.
