Figure 7.

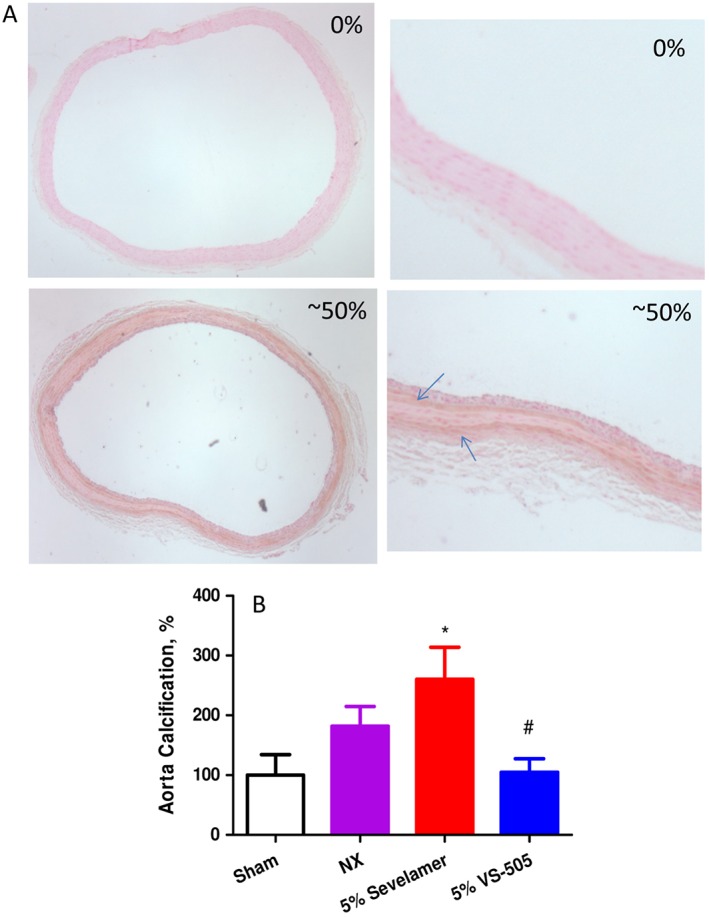
Aorta calcification determination in 5/6 NX rats on a high‐Pi diet. NX rats were treated with 5% vehicle, 5% sevelamer carbonate or 5% VS‐505 in food for 4 weeks as described above. Sham rats on a high‐Pi diet with no addition of vehicle or binders served as control. Aorta was collected and processed as described in the ‘Methods’ section (1–4 aorta rings per rat). The final number of rats per group was as described in Table 1. (A) Two representative samples of stained aortic section: the top sample (0%) with no positive staining (i.e. no brown staining in the whole section) and the bottom one (~50%) with ~50% positive staining (i.e. ~50% of the section showing brown staining). The right panel displays the whole aorta section; the left panel shows an enlarged area of part of the aorta section. Arrow: indicating the positive (brown) staining. (B) Positive (brown) staining in each aorta section was scored as described in the ‘Methods’ section. The average percentage of positive staining for each treatment group was first calculated and then normalized by sham (with an average scored value at 10.3 ± 3.5 mainly due to background) and expressed as % of sham. Mean ± SEM was calculated for each group. Statistical comparisons between two groups were performed by unpaired t‐test with 95% confidence intervals of difference. *P < 0.05 versus sham. # P < 0.05 versus sevelamer.
