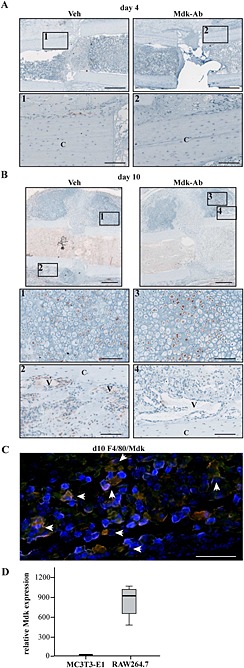
Figure 3.

Mdk expression was decreased in areas of neovascularization and new bone formation by Mdk‐Ab treatment. (A) Mdk staining of fracture calli on day 4. Upper lane, scale bar: 500 μm. Lower lane, scale bar: 100 μm. Images 1 and 2 showing the periosteal region of the fracture callus. (B) Mdk staining of fracture calli on day 10. Upper lane scale bar: 500 μm. Two lower lanes, scale bar: 100 μm. Images 1 and 2 showing the chondrogenic part of the fracture callus and images 3 and 4 showing areas of neovascularization and new bone formation. C, cortex; V, vessels. (C) Representative image of immunofluorescence double staining for Mdk (green) and F4/80 (macrophages; red) of a fractured femur from a vehicle (Veh)‐treated mouse on day 10 after fracture. The area displayed is marked with an asterisk in (B). Cells positive for both F4/80 and Mdk appeared in yellow (marked with white arrows). DAPI (blue) was used for nucleus staining. Scale bar: 100 μm. (D) Expression levels of Mdk in preosteoblastic MC3T3‐E1 cells and macrophage‐like RAW 264.7 cells determined by RT‐PCR. B2M was used as the housekeeping gene.
