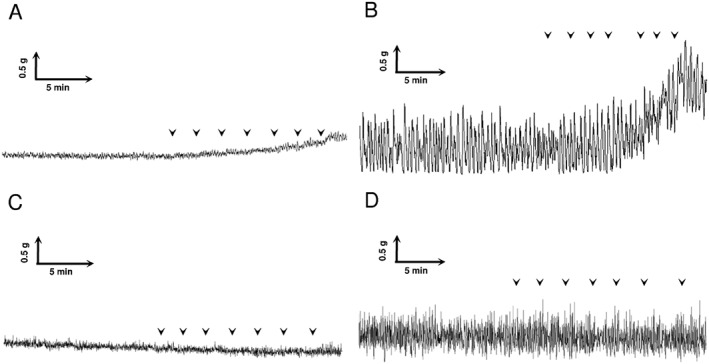
Figure 3.

Representative traces of in vitro bladder contraction recording. Effect of cumulative concentration–response curve with TFLLR‐NH2 (1x10⁻⁷ up to 1x10⁻⁴ M in semi‐logarithmic increment, each arrow represents one concentration) in physiological conditions (A) and 24 h after CYP injection (B). Effect of F16357 (30 μM) on the cumulative concentration–response curve to TFLLR‐NH2 in physiological conditions (C) and 24 h after CYP injection (D).
