Table 3.
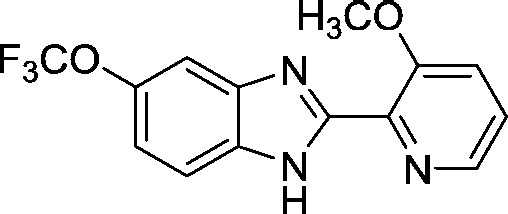
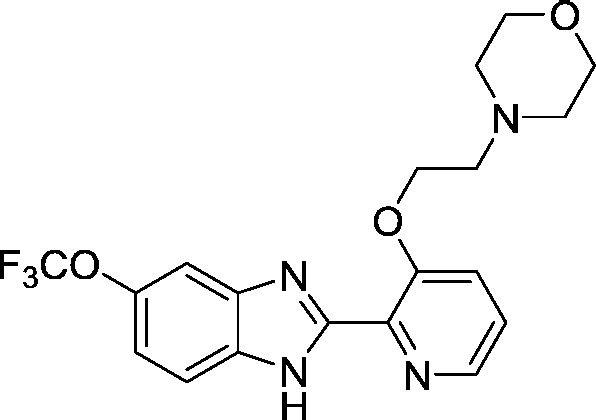
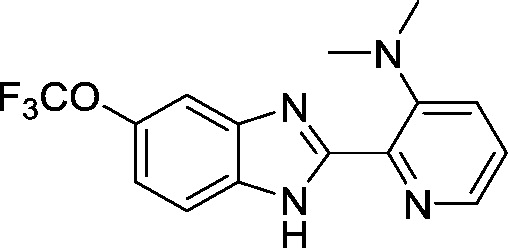
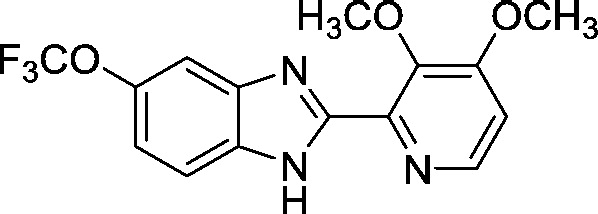
Results of FRET assays for selected compounds. All compounds were measured in duplicate. Each dataset was fit to derive an IC50 value. IC50 values are reported as the average of these two independent fits ± the standard deviation.
| Compound ID | Structure | FRET IC50 (μM) |
|---|---|---|
| AI-4-57 |  |
34.3 ± 0.3 |
| AI-10-47 |  |
3.2 ± 0.5 |
| AI-10-104 (a) |
 |
1.25 ± 0.06 |
| AI-12-16 (b) |
 |
1.7 ± 0.2 |
| AI-14-55 (c) |
 |
4.8 ± 0.3 |
| AI-12-126 (d) |
 |
8.9 ± 1.3 |
| AI-14-91 (e) |
 |
3.0 ± 0.5 |
| AI-14-18 (h) |
 |
5.0 ± 0.3 |
| AI-14-72 (i) |
 |
1.7 ± 0.2 |
