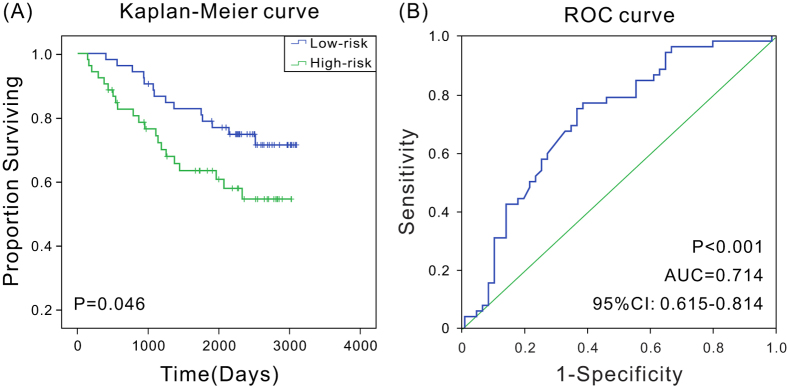
Figure 3. Kaplan–Meier and ROC analysis for overall survival of patients from GSE42568.
(A) Kaplan–Meier survival curves show correlation between expression of three-lncRNA signature and overall survival of patients; (B) ROC curves show the sensitivity and specificity of the three-lncRNA signature in predicting the patient overall survival, AUC = 0.714 (P < 0.001).

