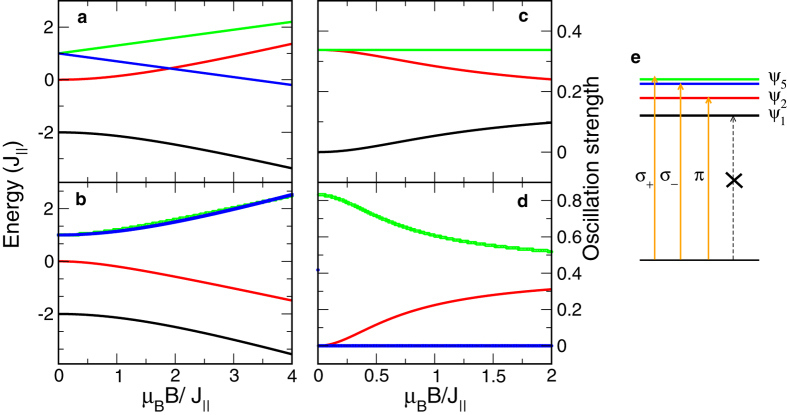
Figure 4. Exciton energies and oscillator strengths vs magnetic field.
Panels (a,b) delineate exciton energies as a function of magnetic field in the Faraday and Voigt configurations, respectively. Panels (c,d) are the oscillator strengths of these exciton states along the z-axis and the x-axis, respectively. Panel (e) illustrates the electric-dipole selection rule of the exciton states. Black and red lines correspond to ψ1 and ψ2 excitons. Green and blue lines correspond to  and
and  excitons in (a,c), and ψ5L and ψ5T in (c,d). Green and blue lines in (c) as well as black and blue lines in (d) are on top of each other.
  .
.

