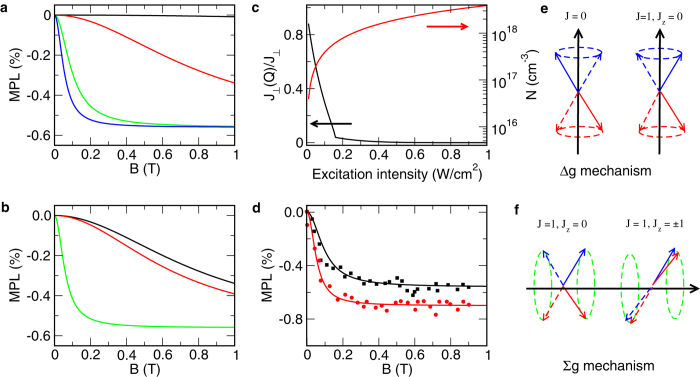
Figure 5. Magnetic field effect in exciton photoluminescence.
Panel (a) describes ΔI1 for exchange splitting between ψ2 and ψ1 being 4J⊥ = 1 (black line), 0.1 (red line), 0.01 (green line), and 0.001(blue line) meV. Panel (b) describes ΔI1 (black line), ΔI2 (red line), and ΔI3 (green line) for  meV. Panel (c) describes the carrier density and the reduction of the exchange as a function of the intensity of excitation light. Panel (d) plots ΔI1 as a function of magnetic field with 4J⊥ = 1 meV for intensities of 0.34 (black line) and 0.85 W/cm2 (red line). Black and red dots are the corresponding experimental values in ref. 12. Panels (e,f) illustrate the Δg and Σg mechanisms. The exciton relaxation time is fixed at 10−10 s.

