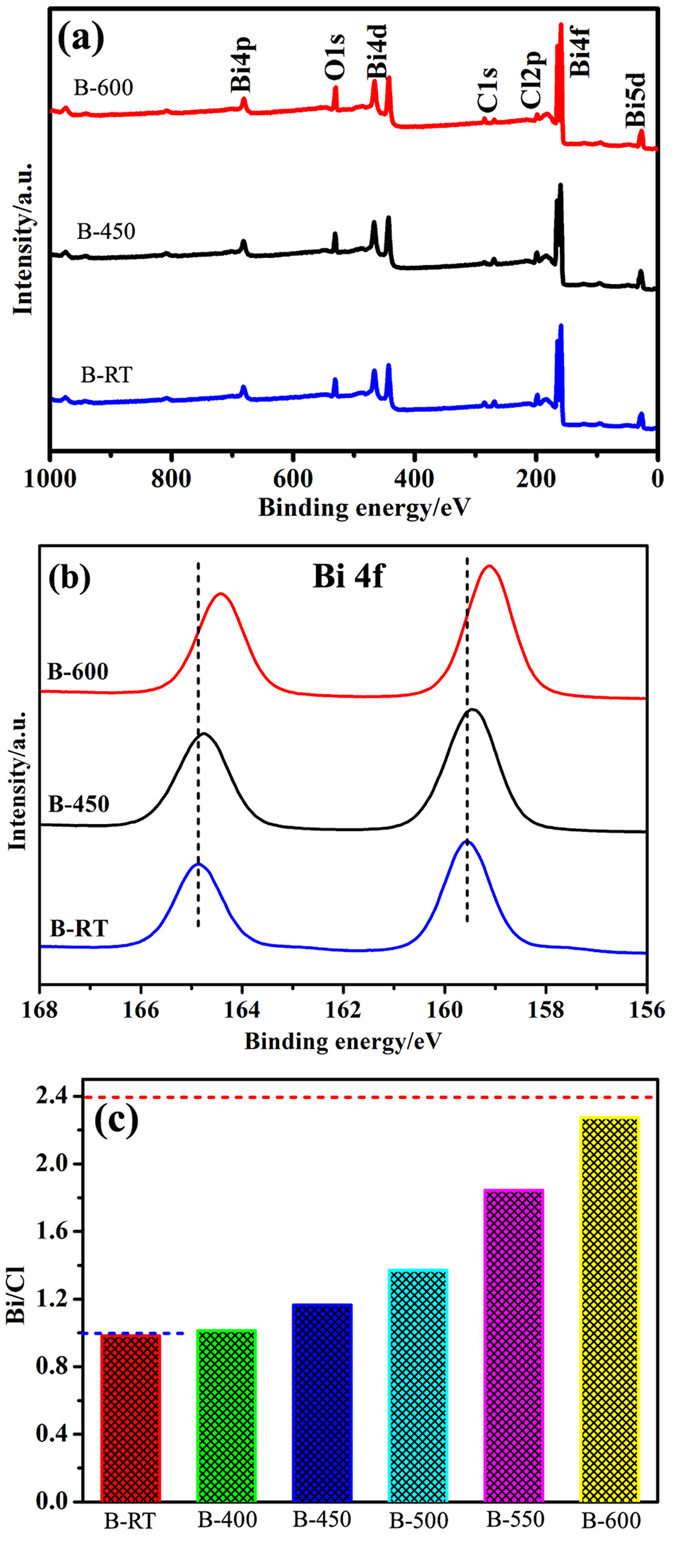
Figure 4.

XPS survey spectra (a) and high-resolution XPS spectra for Bi 4f (b) of samples B-RT, B-450 and B-600, and the variation of Bi/Cl molar ratio as a function of reaction temperature (c). The blue and red dash lines are the theoretical values of Bi/Cl molar ratio for pure BiOCl and Bi24O31Cl10, respectively.
