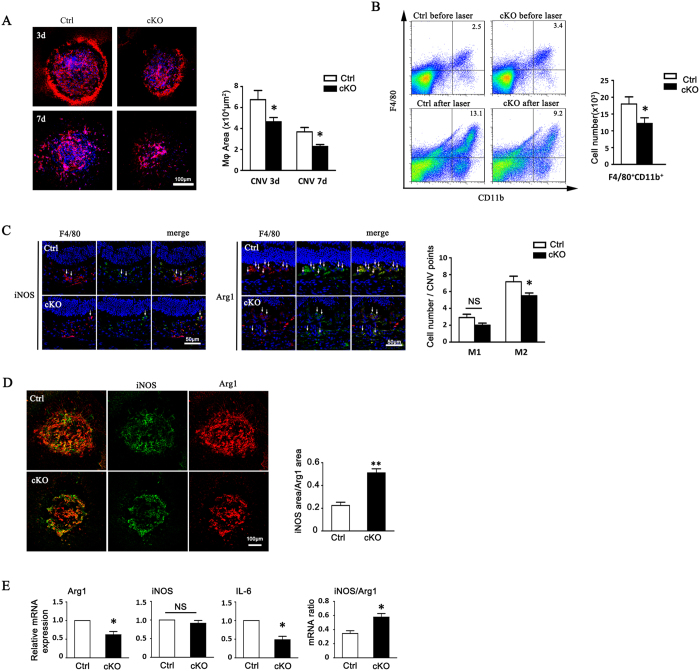
Figure 4. Myeloid specific RBP-J deficiency decreased macrophage infiltration and M2 macrophage polarization in CNV lesions.
(A) RBP-J cKO and control mice were subjected to laser coagulation. Choroidal tissues were flat-mounted and stained with anti-F4/80 as indicated time points. Macrophage infiltration area was represented as pixels and the average pixels per CNV lesion were calculated. Histogram shows the comparisons on the average area of macrophage infiltration in five mice per group. (B) Two eyes of one mouse were adopted as one set to prepare the single cell suspensions from RPE-choroidal tissues in (A) at day 3 after laser injury, and analyzed by flow cytometry. The numbers of F4/80+CD11b+ cells were compared between the two groups (five mice per group). (C) Retinal tissues of mice in (A) were immunolabeled with F4/80 and Arg1 or F4/80 and iNOS at day 3 after injury. Arrow indicates Arg1+ macrophages or iNOS+ macrophages. Three representative images per lesion were randomly selected from three biggest CNV lesions in each eye for cell count, and the average number of F4/80+Arg1+ or F4/80+iNOS+ macrophages was calculated and compared in five eyes per group. (D) Flat-mounted choroidal tissues of mice in (C) were immunolabeled with Arg1 and iNOS. The total pixels of iNOS and Arg1 were measured to calculate the ratio of M1/M2. The ratio of M1/M2 was compared between two groups (five eyes per group). (E) Total RNA was prepared from choroidal lysates of RBP-J cKO and control mice at day 3 after laser injury. Two eyes of one mouse were adopted to prepare the RNA retraction for qPCR. The mRNA level of Arg1, iNOS, and IL-6 determined with qRT-PCR, with β-actin as an internal reference control. Each individual experiment was repeated at least three times. The expressions of Arg1, iNOS, IL-6, and the ratio of iNOS/Arg1 were compared. Data are presented as mean ± SEM of five eyes or mice per group. *P < 0.05. NS, no significance.

