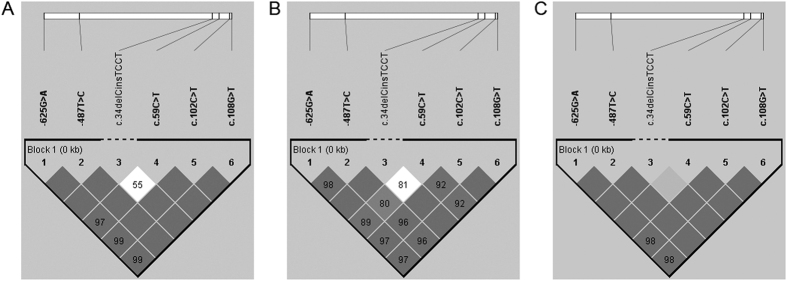
Figure 2. Haplotype block structure for the associated HTRA1 polymorphisms.
The haplotype analysis revealed linkage disequilibrium (LD) blocks lying across all of the associated HTRA1 polymorphisms except for the c.34delCinsTCCT in (A) exudative AMD, in (B) PCV and in (C) control subjects. The displayed value of the LD was D’ (the value of D’ × 100, threshold = 0.8), and the r2 threshold was 0.8.

