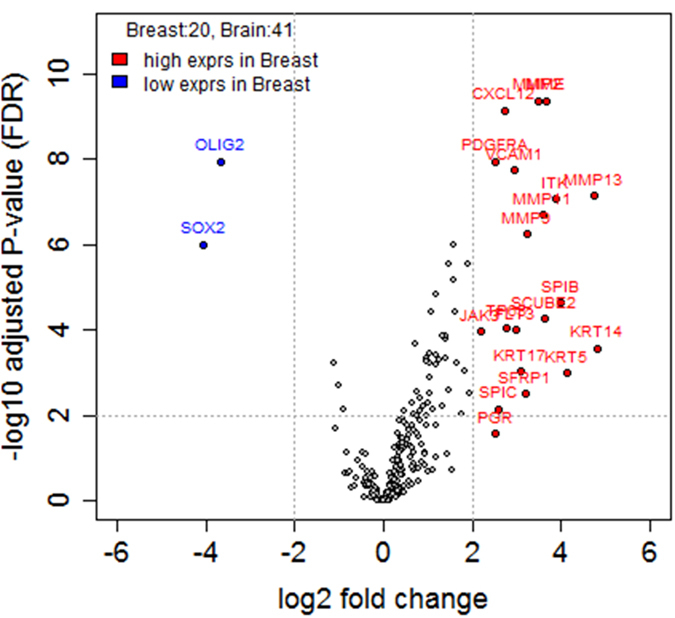
Figure 2. Gene expression profiles of the 20 primary breast cancers (BC) compared to those of the 41 breast cancer brain metastases (BCBM).

Volcano plots show the distribution of the fold changes in gene expression. Genes with absolute fold change ≥2 and adjusted P-value FDR < 0.05 are indicated in red (high expression in primary BC compared to BCBM) and blue (low expression in primary BC compared to BCBM). Comparisons were analyzed using Student’s t-test.
