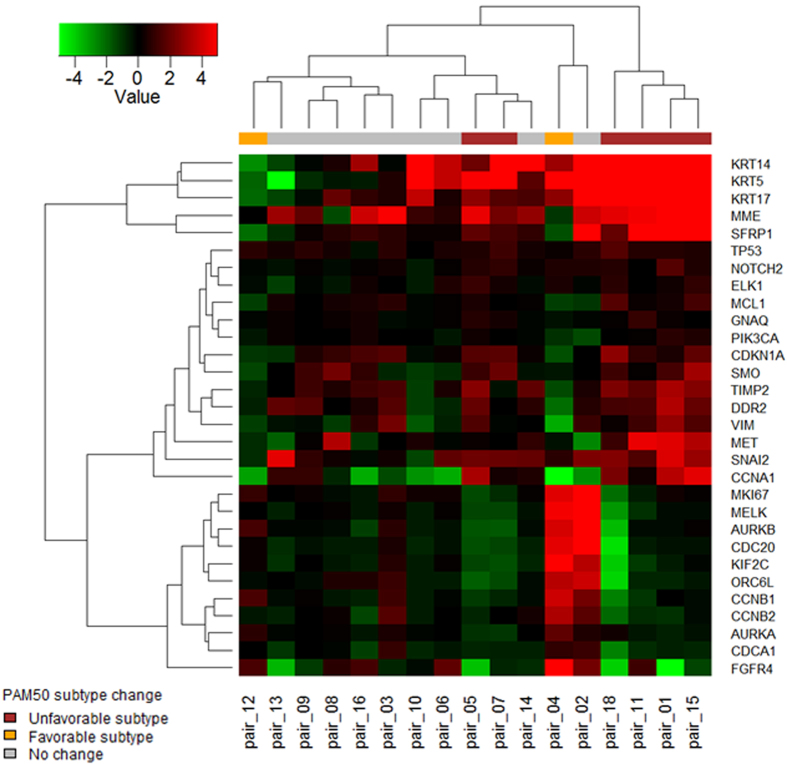
Figure 4. Heat map showing the top 30 significant genes that were differentially expressed between primary BC and BCBM in patient-matched paired samples.
Red, pairs that converted toward the unfavorable subtype; orange, pairs that converted toward the favorable subtype; gray, pairs that did not change subtype. Hierarchical clustering was performed with the complete linkage method using the Euclidean distance measure.

