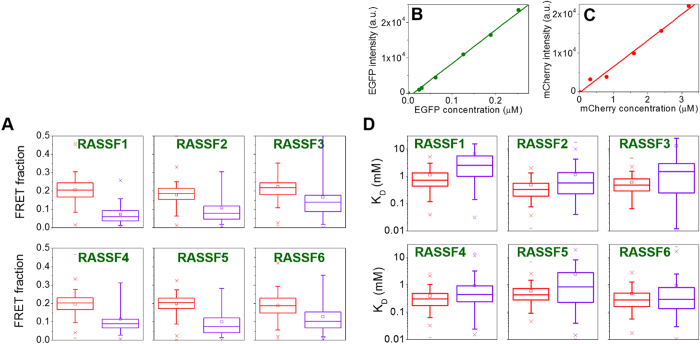
Figure 10. Results of global fitting of the donor fluorescence decay data underlying Fig. 9 to a double exponential decay model.
(A) FRET population fractions for RASSF1-6 interacting with SARAHMST1 (red) and full length MST1 (purple). (B,C) EGFP and mCherry calibration of intensity versus fluorophore concentration. (D) Dissociation constants (KD) for RASSF1-6 interacting with SARAHMST1 (red) and full length MST1 (purple).

