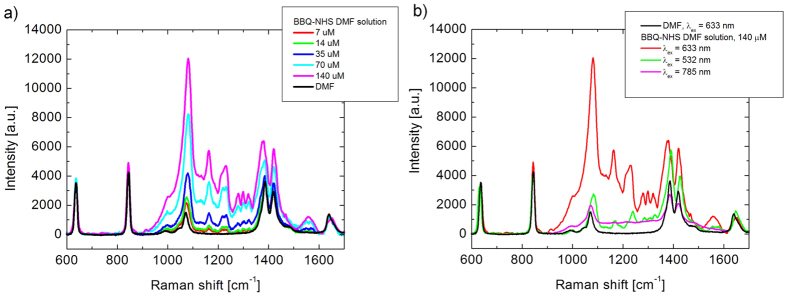
Figure 2. Dependence of the Raman signal of BBQ650-NHS on the excitation wavelength and concentration.
(a) A correlation between the concentration of BBQ650-NHS solution in DMF and the intensity of Raman spectra under 633 nm excitation. (b) Raman spectra of the BBQ-NHS solution in DMF obtained with different excitation sources, as labeled; the band at 1087–1133 cm−1 was used for BBQ-NHS detection. It shows that excitation with 633 nm generates a significant RR signal enhancement.

