Figure 6.
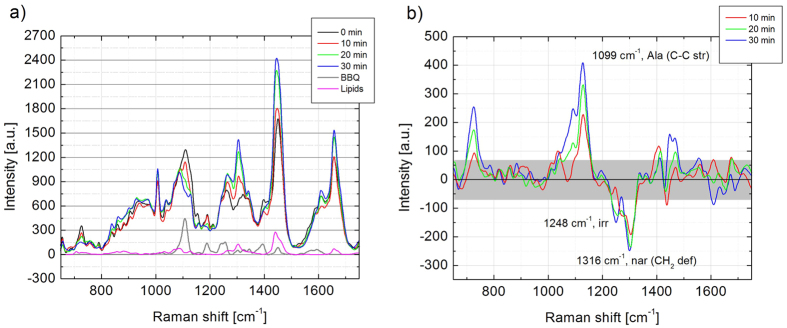
(a) Time sequence of the Raman spectra of lysosome, together with the Raman spectra of BBQ (grey curve) and of cellular lipids (magenta curve). (b) The residual spectra after subtracting of 10, 20 and 30 min sequential Raman spectra of lysosome from that of 0 min (starting point of measurement). The spectra of BBQ and lipids were subtracted with corresponding weight coefficient as well. Abbreviations: Ala–alanine, str–stretch, irr–irregular, nar–unspecified non-aromatic side-chain, def–deformation. The Grey box shows measurement standard error frame.

