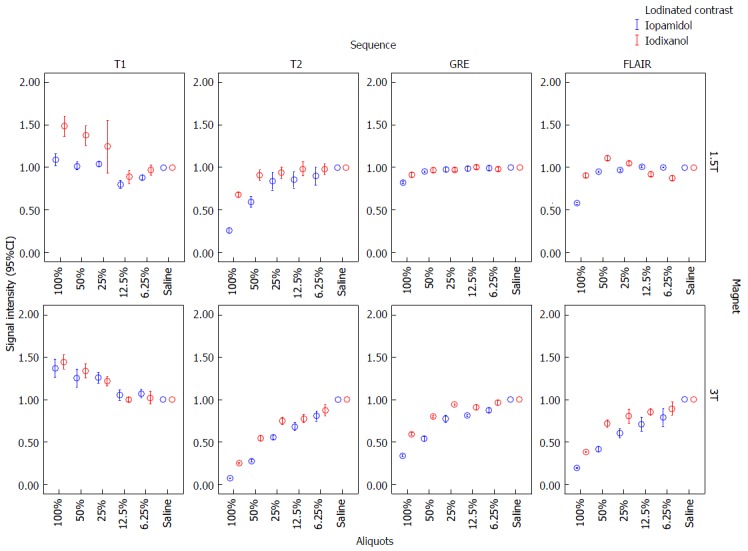
Figure 2.

Error-bars graphic analysis of signal intensity for various sequences, magnetic fields and iodinated contrasts. Note both iopamidol and iodixanol demonstrated increased SI on T1 and decreased SI on SE-T2, GRE and FLAIR at 1.5T and 3T, as the concentration of ICM mixed with saline was increased. Signal intensity = (SI-contrast/SI-saline). SI: Signal intensity; ICM: Iodinated contrast material; SE: Spin-echo; GRE: Gradient-echo; FLAIR: Fluid-attenuation-inversion-recovery.
