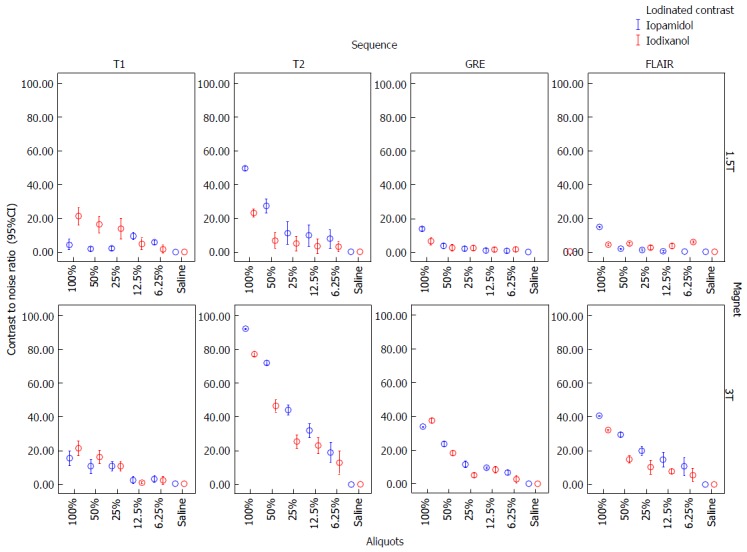
Figure 3.

Error-bars graphic analysis of contrast to noise ratios for various sequences, magnetic fields and iodinated contrasts. Note the highest contrast to noise ratios (CNR) on T2-WI in both magnetic fields and the increased CNR at 3T due to the expected increase in signal-to-noise ratio. Inconspicuity for detection would be expected on GRE sequences as demonstrate by low CNRs, particularly at 1.5T. The CNRs increased in all cases as concentration of contrast increases. GRE: Gradient-echo; FLAIR: Fluid-attenuation-inversion-recovery.
