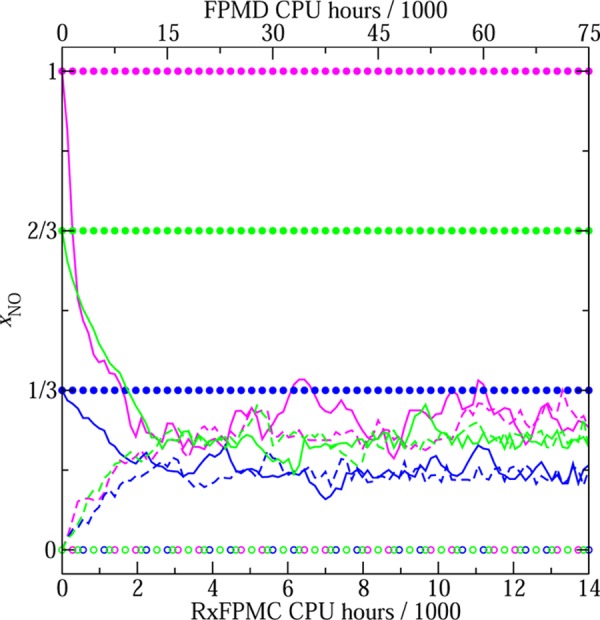
Figure 1.

Evolution of instantaneous values for the molar fraction of nitric oxide with runtime. The magenta, green, and blue colors denote 192-atom systems with N:O ratios of 1:1, 2:1, and 5:1, respectively. Each RxFPMC simulation consists of 100 MC cycles (taking a total of 14 000 CPU hours, see x-axis scale at bottom), and each FPMD simulation covers 60 ps (taking a total of 75000 CPU hours, see x-axis scale at top). The solid lines and filled circles correspond to RxFPMC and FPMD trajectories, respectively, that started with all oxygen atoms being present in the form of NO molecules and the excess nitrogen atoms in the form of N2 molecules. The dashed lines and open circles correspond to RxFPMC and FPMD trajectories, respectively, that started with all atoms being present in the form of N2 and O2 molecules.
