
Figure 2.
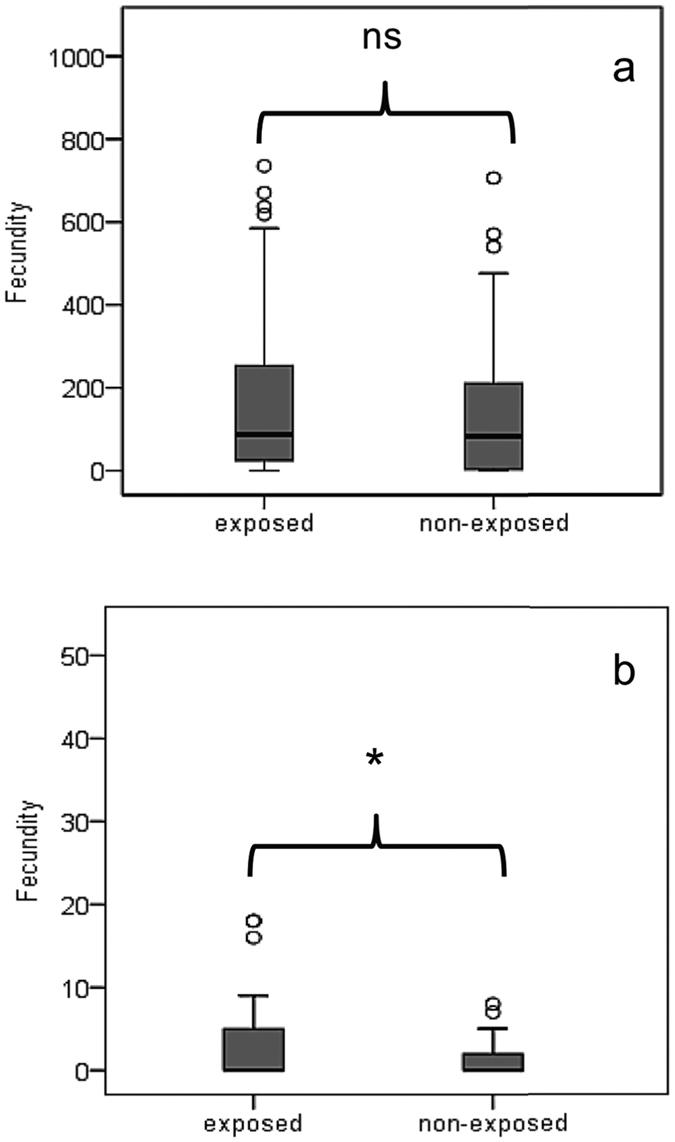
Box plots depicting life time fecundity rates (eggs per female) of females experiencing FD (a) and DR (b) food conditions and had either exposed or remained unexposed to α-pinene. Asterisk indicates significant differences between female cohorts (squared Wald test x2 = 81.219; df = 1; P < 0.05).