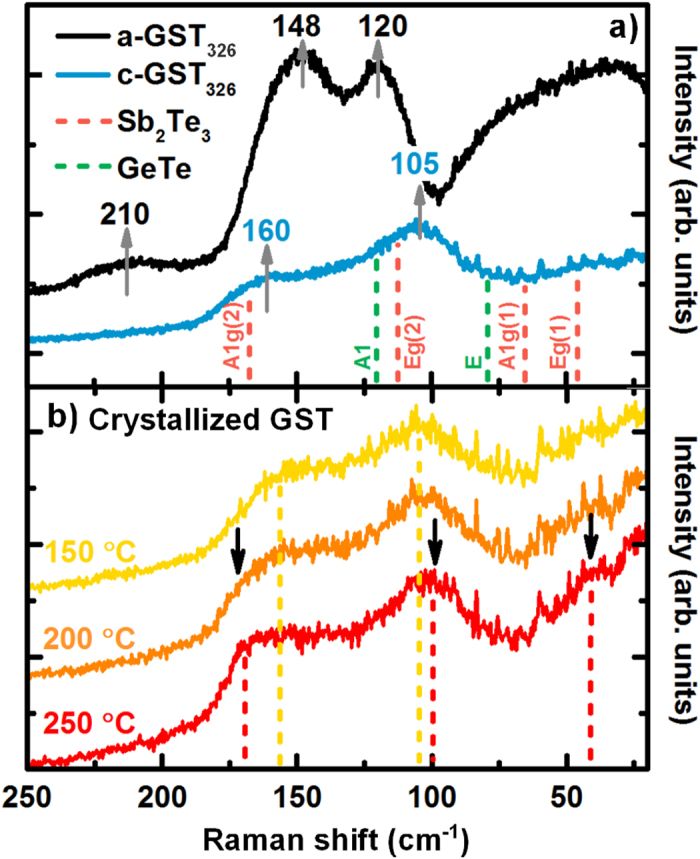
Figure 1.

(a) Comparison of Raman spectra for a-GST326 (black) and as grown c-GST326 (blue); gray arrows highlight the mode positions. Sb2Te3 (red) and GeTe (green) Raman mode positions are plotted as references. (b) Raman spectra of crystallizing a-GST326 for three different temperatures. Modes of metastable c-GST326 are highlighted with yellow dashed lines. Upon increasing the temperature new modes appear, indication of the transition from c- to t-GST. At T = 200 °C the characteristic mode of t-GST (~170 cm−1) appears (red dashed lines). In the red curve (T = 200 °C) the two arrows highlight the other two modes of the t-GST.
