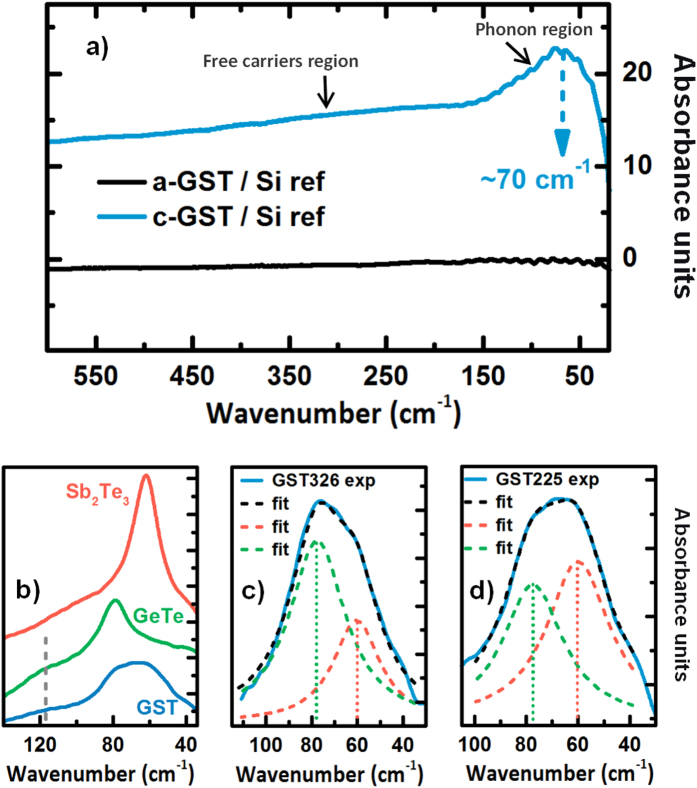
Figure 2.
(a) FIR absorbance spectra for a-GST326 and c-GST326, black and blue curves, respectively. The spectra are normalized to the Si substrate. (b) Zoom around GST225 absorption feature (30 to 140 cm−1) (blue), with Sb2Te3 (red) and GeTe (green) spectra as references. (c) Fit of the GST326 experimental curve using two Lorentzian peaks centered at the position of the Sb2Te3 (red) and GeTe (blue) modes. (d) Fit of GST225 for comparison.

