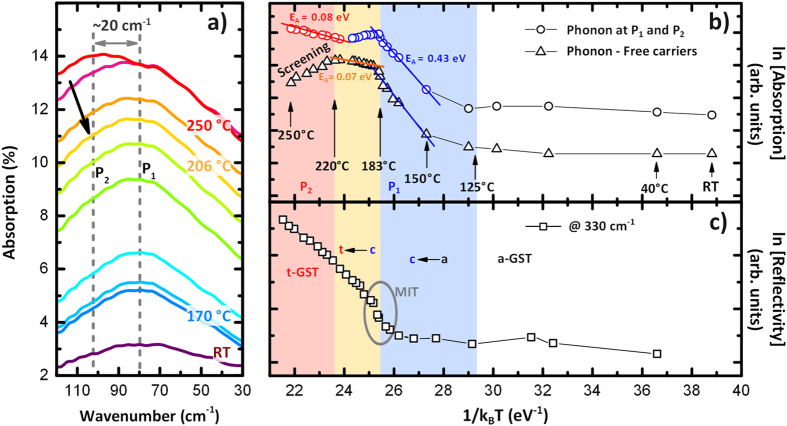
Figure 3.
(a) Temperature dependent absorption spectra of crystallizing a-GST326 around the main absorption feature. (b) Arrhenius plot based on the intensity evolution of the phonon dominated region: peak P1 for c-GST326 and P2 for t-GST (empty circles), and difference between phonon and carrier dominated region (at 330 cm−1) intensities evolution (empty triangles). Activation energy of the conduction process (blue for cubic- and red for t-GST) are obtained after fitting. (c) Arrhenius plot of the evolution of the reflectivity at 330 cm−1. Four main regions are visible in (b,c): white for a-GST326, blue for c-GST326, orange for the transition from c- to t-GST and red for t-GST.

