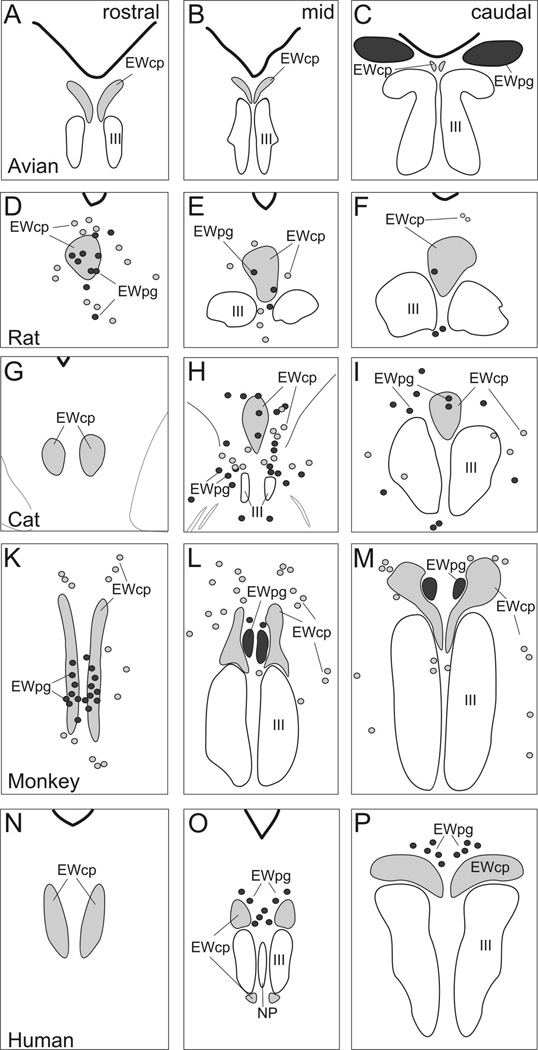
Figure 3.
Line drawings showing the organization of EWpg and EWcp in several selected species: avian, rat, cat, monkey, and human. Representative rostral (left column), middle (middle column) and caudal (right column) sections are shown. The EWcp is indicated by light gray shading and EWpg is indicated by dark gray shading. Scattered cells located outside the nuclear boundaries are indicated by appropriately shaded circles. (From Kozicz et al., 2011) (195).

