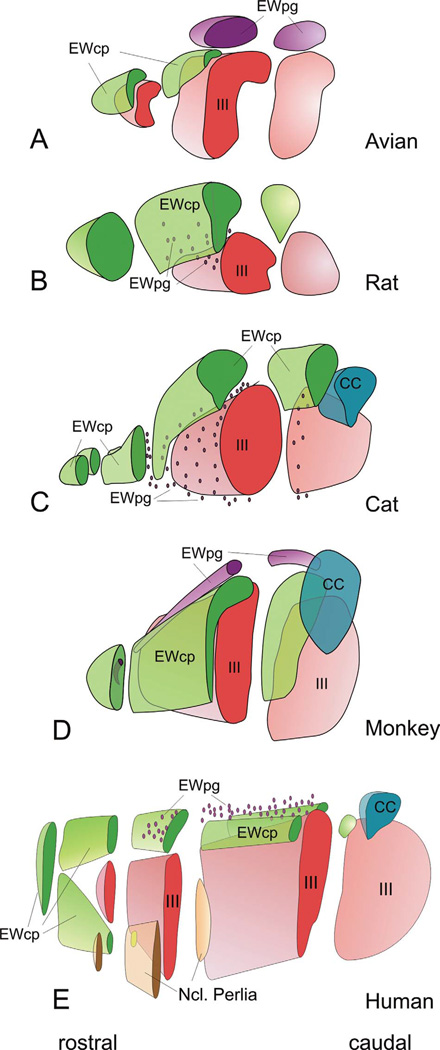
Figure 4.
Three dimensional (3-D) representations of human, macaque, cat, rat and pigeon oculomotor complex, to illustrate the 3-D organization of EWpg and EWcp. The 3-D models are cut at selected points to illustrate how frontal sections through this level would look. In cases where the population is scattered, and so not contained in a discrete nucleus, dots are used. (From Kozicz et al., 2011) (195).

