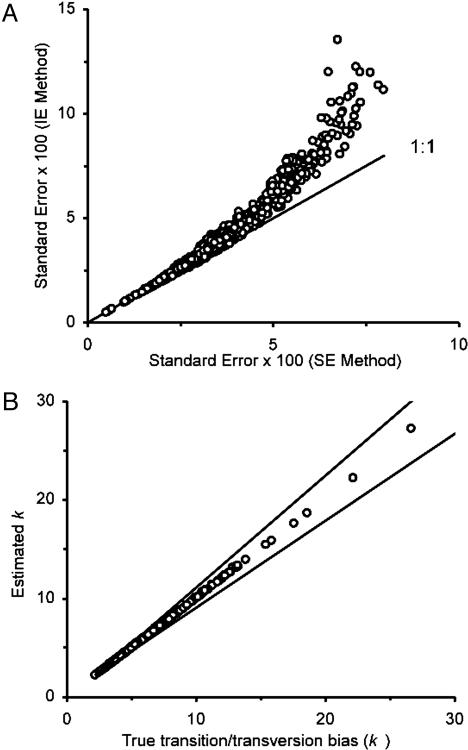
Fig. 3.
Standard errors and transition/transversion rate ratios obtained by the SE method. (A) Relationships between the standard errors of evolutionary distances obtained by the IE and SE methods for a data set of 66 computer-generated sequences according to the model tree in Fig. 2 A. The TN model was used for generating sequence data with the transition/transversion rate ratios k1 and k2 = 4.4, G + C content (θ) = 0.61, and sequence length n = 1,066 nucleotides. There are (66 × 65)/2 = 2,145 data points in this figure. (B) Relationships between the estimated and true values of k (= [k1 + k2]/2) for 448 different patterns of nucleotide substitutions (see text). For each pattern of nucleotide substitution, the average value (circles) and the 95% confidence limits (lines) of the estimate of k were obtained from 100 data sets generated by computer simulation with the model tree in Fig. 2 A.

