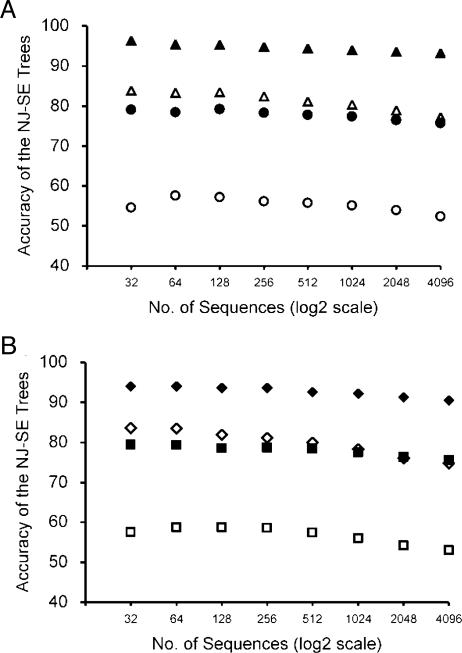
Fig. 5.
Accuracies (PC) of NJ-SE trees with increasing numbers of sequences when the TN model was used. (A) Type B and type C model trees in Fig. 2 were used. For nuclear gene evolution, k1 = k2 = 4, gA = gT = gC = gG = 0.25, and n = 1,000 were used for both type B trees (filled circles) and type C trees (filled triangles). For mitochondrial gene evolution, k1 = k2 = 20, gA = gT = 0.40, gC = gG = 0.10, and n = 1,000 were used for both type B trees (open circles) and type C trees (open triangles). (B) Type D and type E model trees in Fig. 2 were used. For nuclear gene evolution, k1 = k2 = 4, gA = gT = gC = gG = 0.25, and n = 1,000 were used for both type D trees (filled squares) and type E trees (filled diamonds). For mitochondrial gene evolution, k1 = k2 = 20, gA = gT = 0.40, gC = gG = 0.10, and n = 1,000 were used for both type D trees (open squares) and type E trees (open diamonds).

